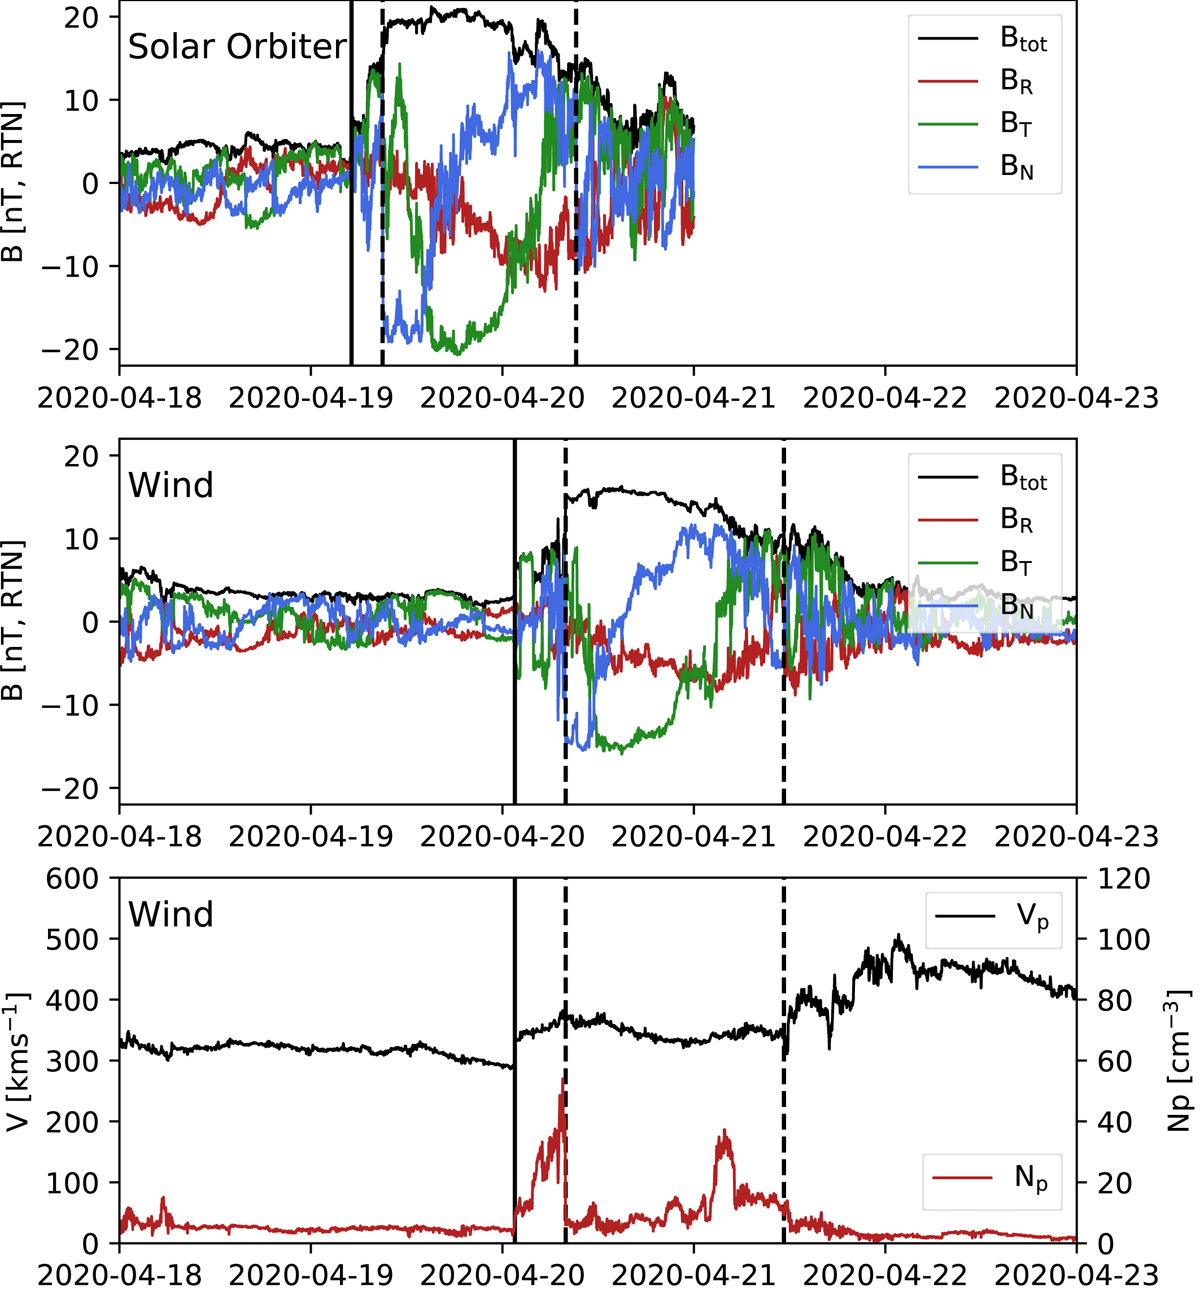
Fig. 1.
Download original image
In situ observations of the CME. In each panel, the shock front is delineated by the solid vertical line, and the magnetic flux rope boundaries are shown by the vertical dashed lines. Top panel: Solar Orbiter magnetic field data in radial-tangential-normal (RTN) coordinates, where the total magnetic field magnitude is shown in black and the magnetic field components, RTN, are in red, green, and blue, respectively. Middle panel: wind magnetic field data in RTN coordinates, displayed similarly to that of Solar Orbiter. Bottom panel: proton speed (black) and density (red) measured by Wind.
Current usage metrics show cumulative count of Article Views (full-text article views including HTML views, PDF and ePub downloads, according to the available data) and Abstracts Views on Vision4Press platform.
Data correspond to usage on the plateform after 2015. The current usage metrics is available 48-96 hours after online publication and is updated daily on week days.
Initial download of the metrics may take a while.