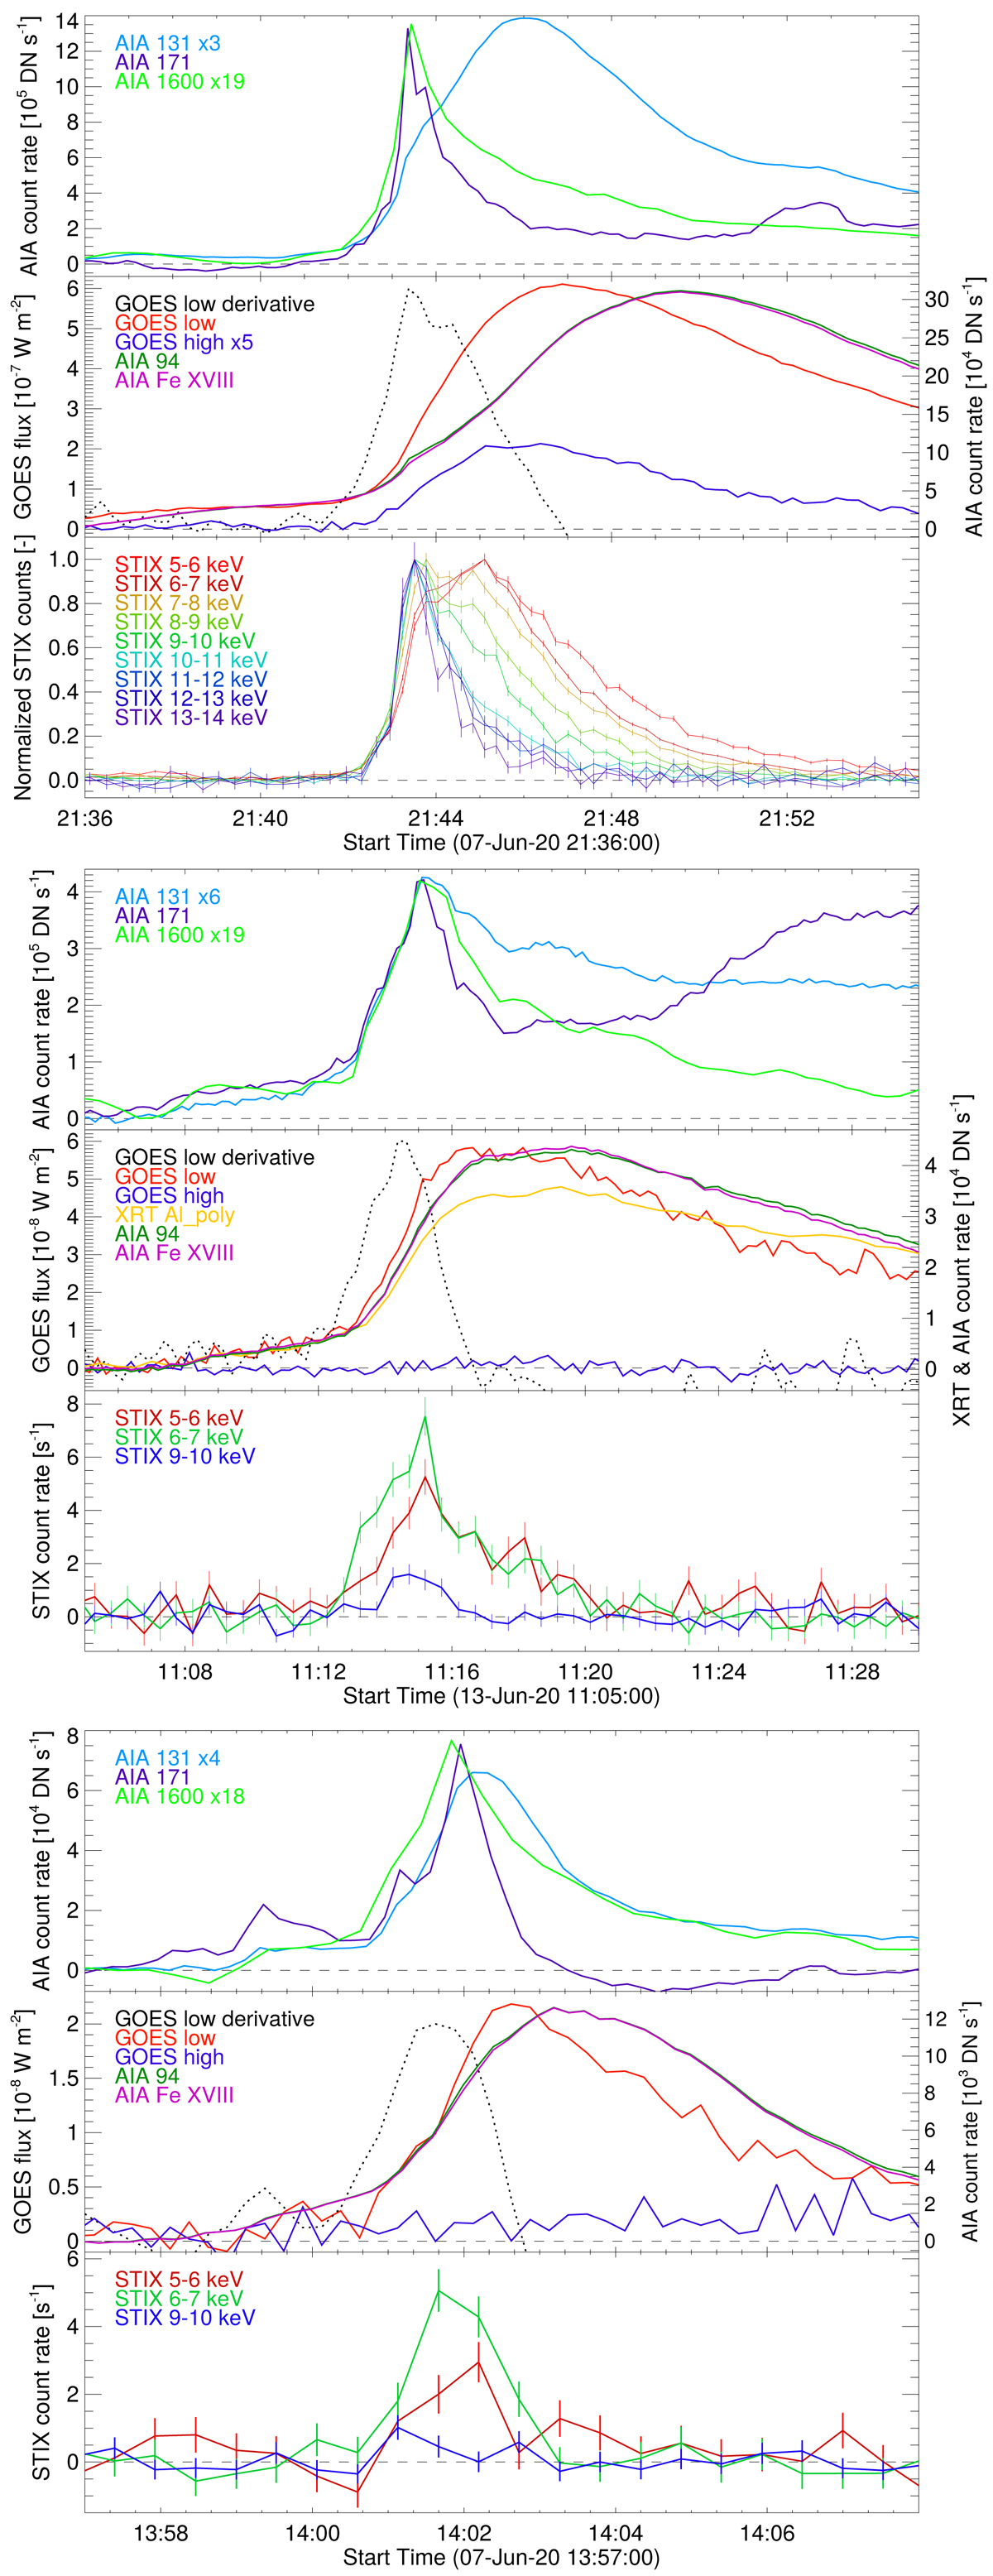
Fig. 9.
Download original image
Time profiles at various wavelengths for three microflares: (top) the B6 GOES microflare on June 7, (middle) the A6 GOES microflare on June 13 and (bottom) the A2 GOES microflare on June 7. The color-coded legend in each plot indicates the nature of the light curve. Each event is illustrated as follows: in the top and middle panels of each figure, we show the emission mostly coming from the ribbons and the coronal loops, respectively, while in the bottom panel the STIX light curves are shown.
Current usage metrics show cumulative count of Article Views (full-text article views including HTML views, PDF and ePub downloads, according to the available data) and Abstracts Views on Vision4Press platform.
Data correspond to usage on the plateform after 2015. The current usage metrics is available 48-96 hours after online publication and is updated daily on week days.
Initial download of the metrics may take a while.