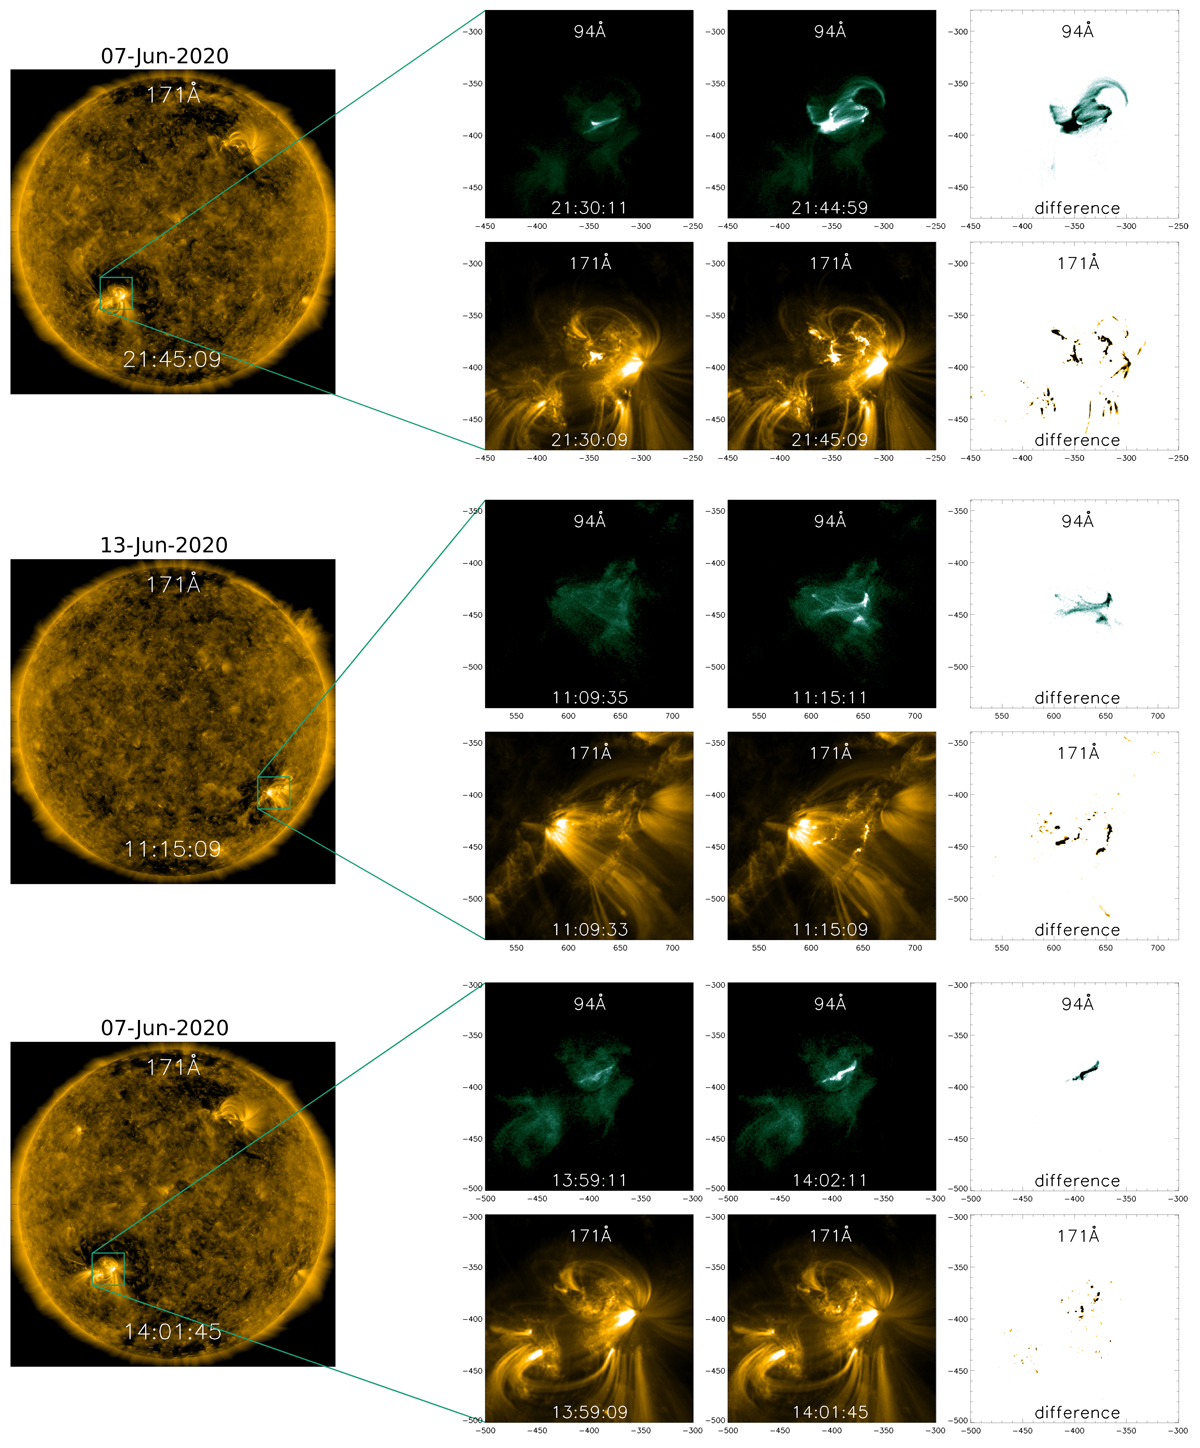
Fig. 8.
Download original image
Sequences of SDO/AIA images in the 94 Å and 171 Å passbands for three microflares: (top) the B6 GOES microflare on June 7, (middle) the A6 GOES microflare on June 13 and (bottom) the A2 GOES microflare on June 7. Each panel is organized in the same way: on the left, a full-disk image of the 171 Å band is shown; on the right, close-ups of the corresponding sequences of the microflares, in which the first two columns refer to distinct times while the last column indicates the difference between them. The color map of the difference image has been reversed in order to better highlight the changes due to the flares.
Current usage metrics show cumulative count of Article Views (full-text article views including HTML views, PDF and ePub downloads, according to the available data) and Abstracts Views on Vision4Press platform.
Data correspond to usage on the plateform after 2015. The current usage metrics is available 48-96 hours after online publication and is updated daily on week days.
Initial download of the metrics may take a while.