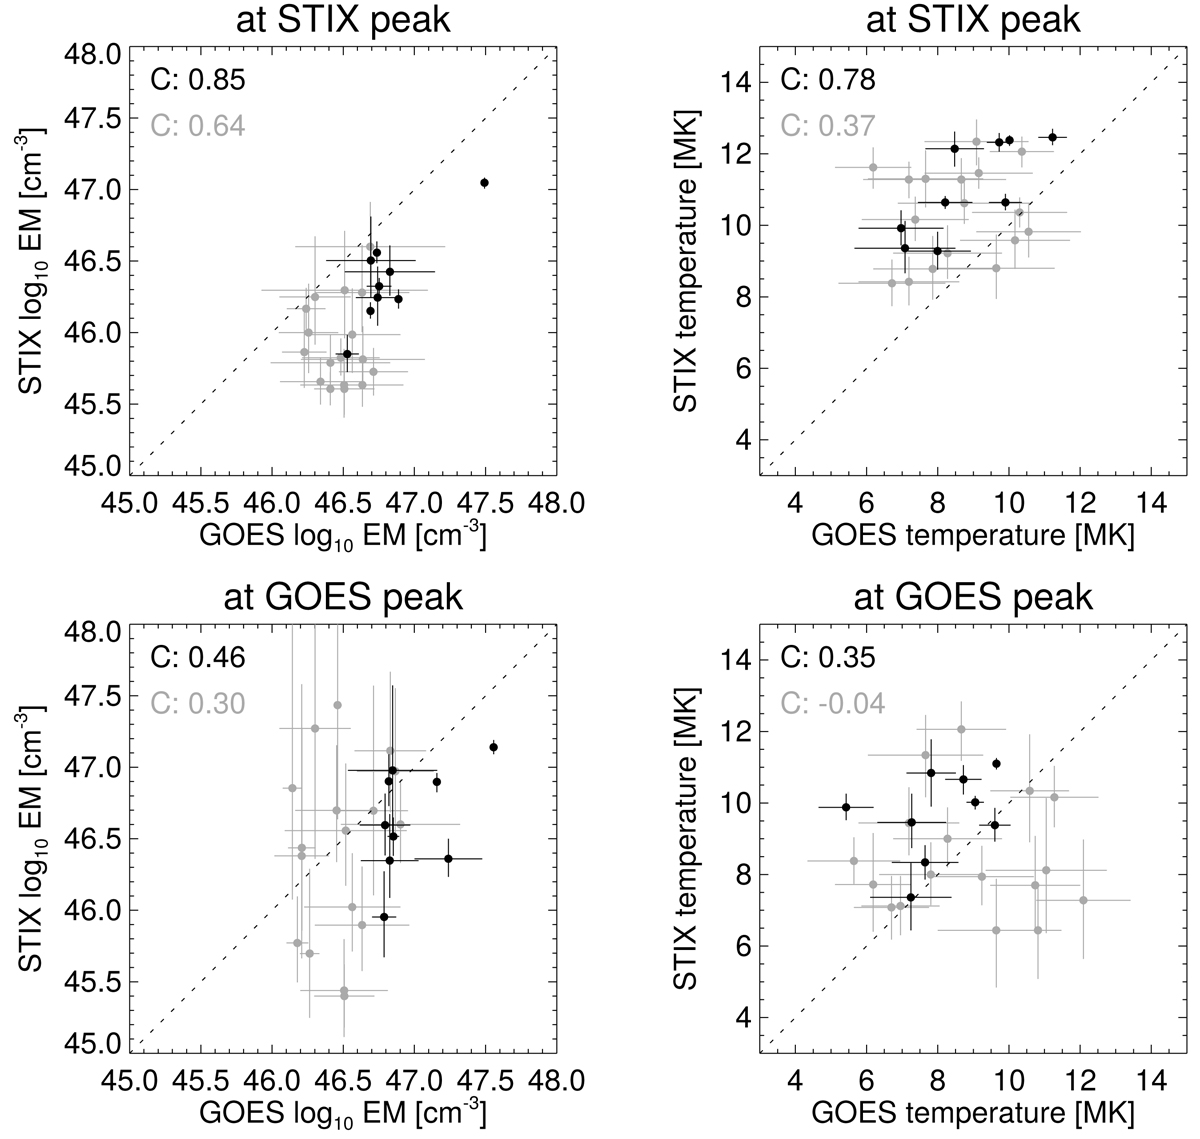
Fig. 7.
Download original image
Correlation plots of the emission measures (left) and temperatures (right) derived from STIX and GOES under the assumption of an isothermal plasma. The parameters were determined at the times of the peak of the STIX count rate (top) and at the GOES peak flux (bottom). Black symbols refer to flares with GOES class A6 or larger, while light grey symbols refer to weaker events. C denotes the linear correlation coefficient for the temperatures and the logarithms of the EM (black for events larger than A6, grey for all events). The dotted lines denote x = y. We note that STIX generally yields lower EMs and higher temperatures than GOES during the earlier phase around the STIX peak. For the stronger events, this is also the case in the later phase around the GOES peak.
Current usage metrics show cumulative count of Article Views (full-text article views including HTML views, PDF and ePub downloads, according to the available data) and Abstracts Views on Vision4Press platform.
Data correspond to usage on the plateform after 2015. The current usage metrics is available 48-96 hours after online publication and is updated daily on week days.
Initial download of the metrics may take a while.