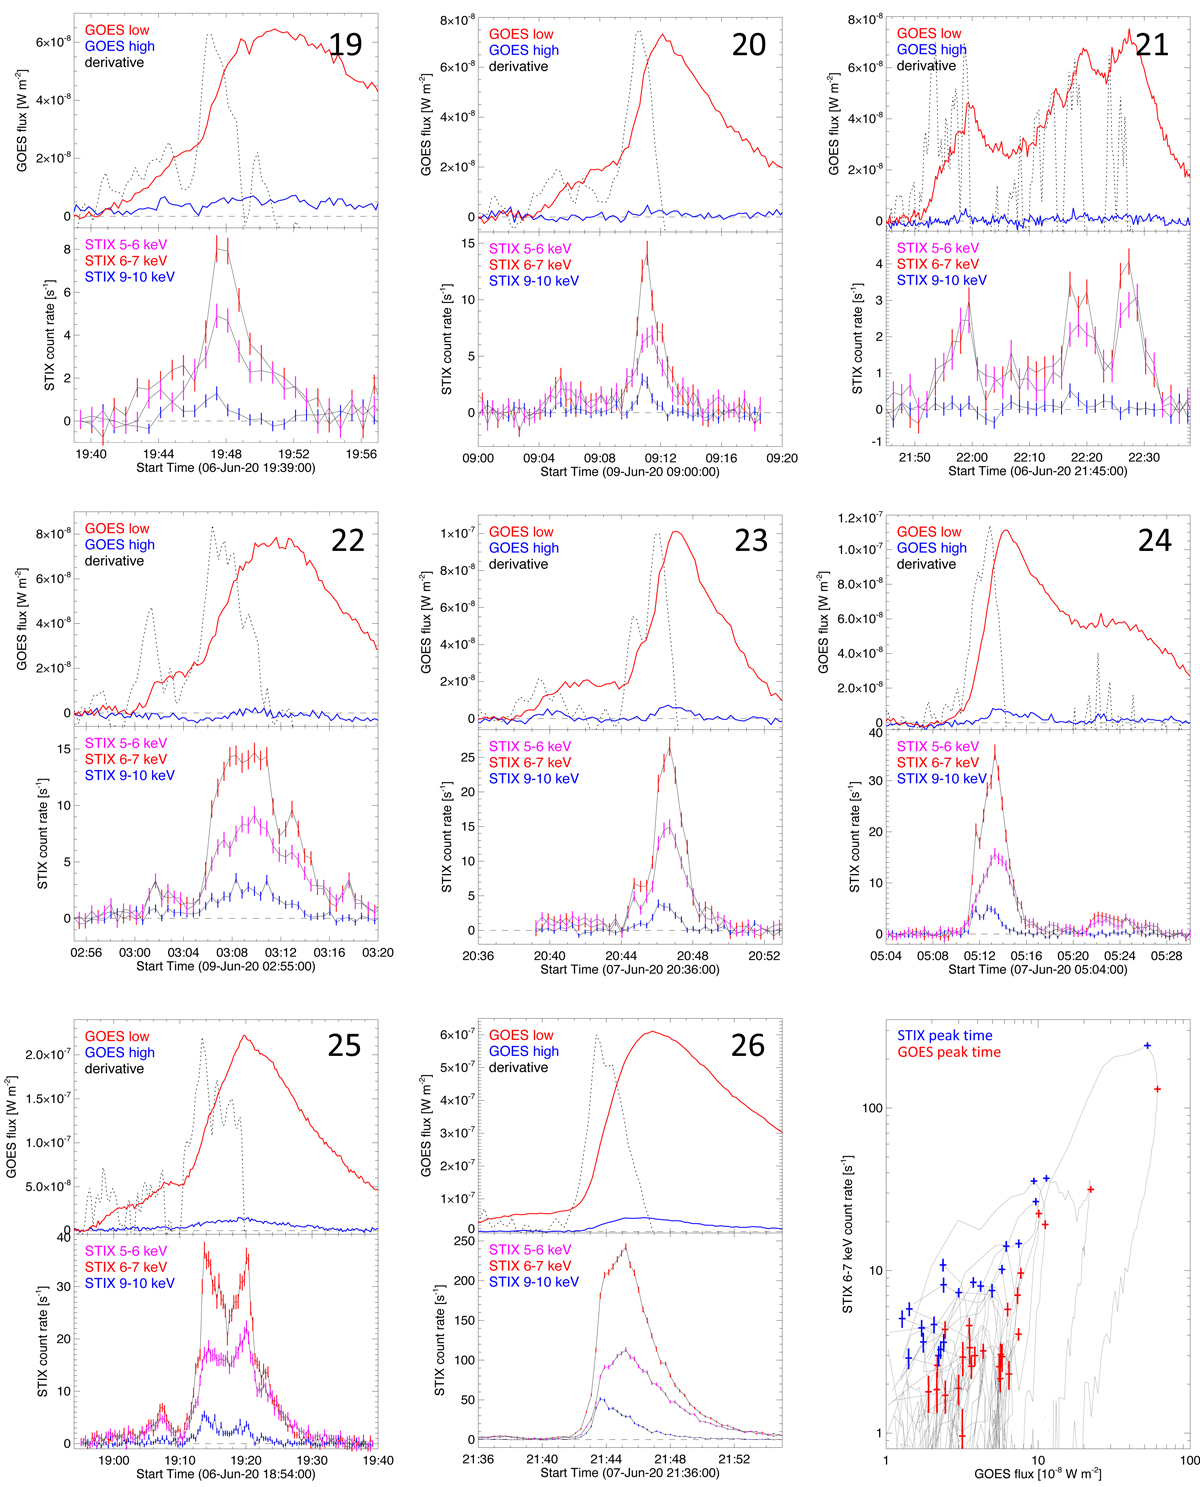
Fig. 5.
Download original image
GOES and STIX light curves for the largest size microflares (GOES A6 to B6) in our sample. Same format as previous figure. In addition, the last panel shows the scatter plot of the STIX 6–7 keV count rate as a function of the GOES 1–8 Å low energy channel for all events. The blue and red points mark the values at the STIX and GOES peak time, respectively, while gray lines connect the different points according to the time evolution.
Current usage metrics show cumulative count of Article Views (full-text article views including HTML views, PDF and ePub downloads, according to the available data) and Abstracts Views on Vision4Press platform.
Data correspond to usage on the plateform after 2015. The current usage metrics is available 48-96 hours after online publication and is updated daily on week days.
Initial download of the metrics may take a while.