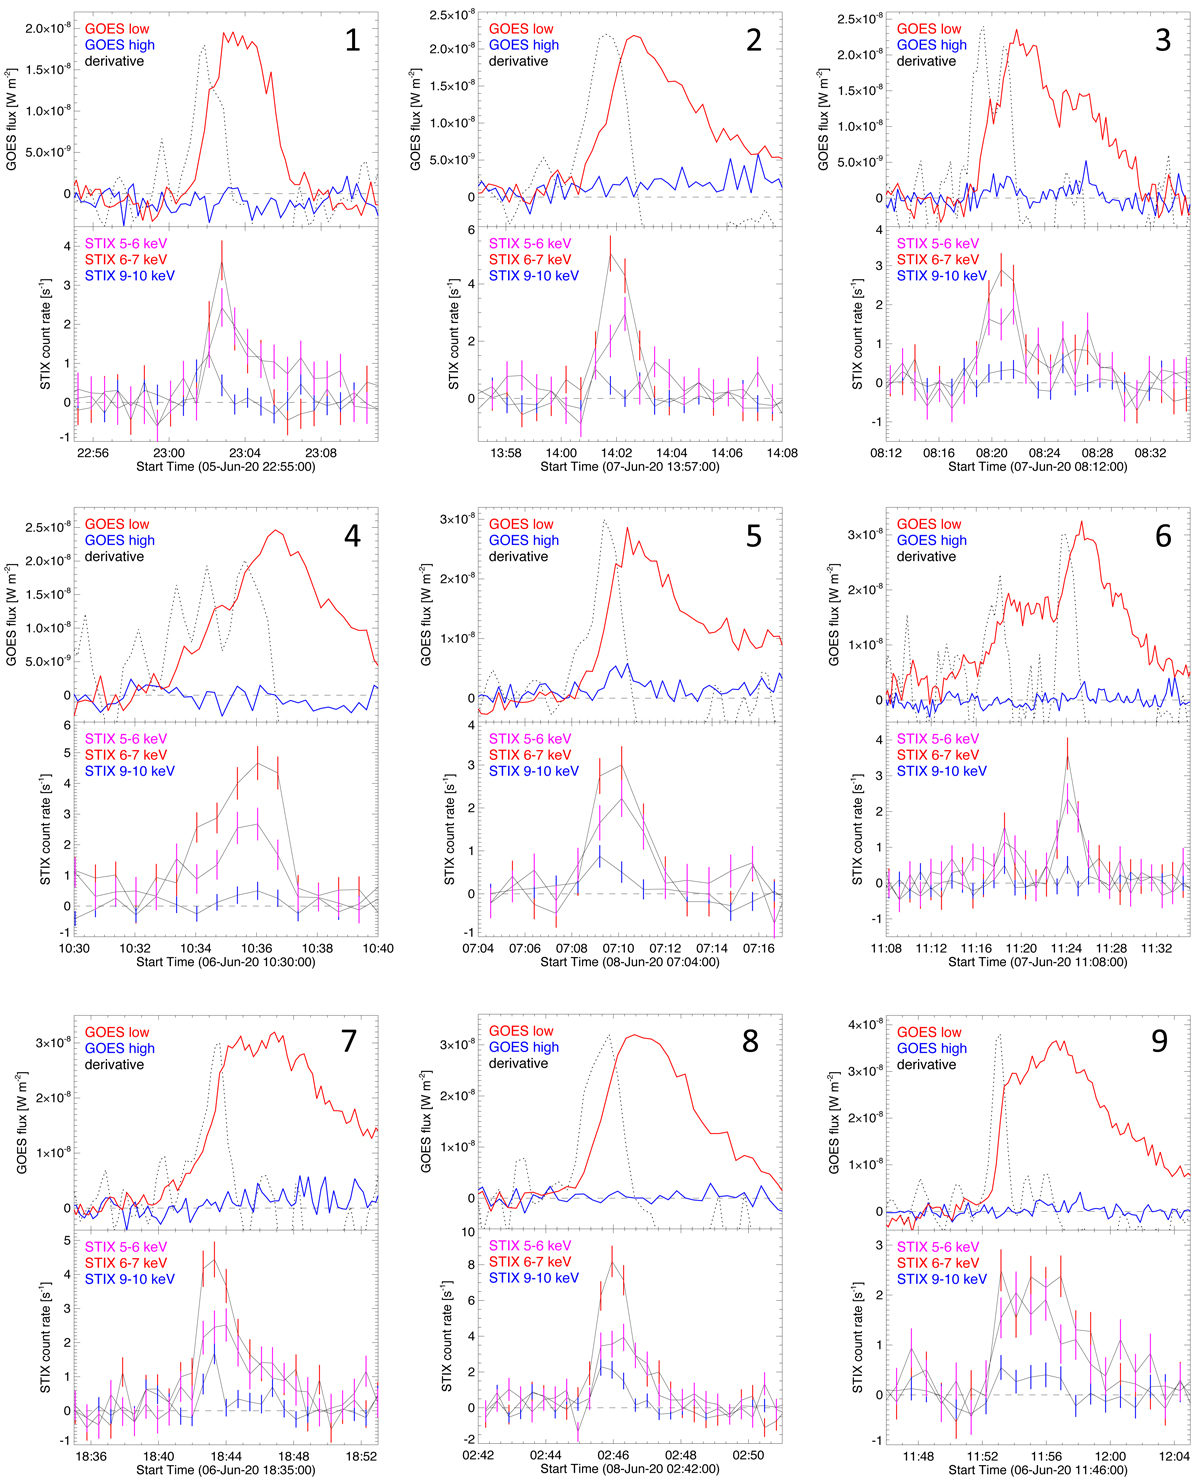
Fig. 3.
Download original image
GOES and STIX light curves for the smallest of the selected microflares of GOES classes below A4. For each flare, in the top panels the GOES light curves are shown after background subtraction, while below the background subtracted and livetime-corrected STIX count rates for three science energy bins are displayed with error bars. The STIX time profiles have been adjusted for the light travel time to Earth. For reference, the GOES low energy channel derivative is shown in dotted black.
Current usage metrics show cumulative count of Article Views (full-text article views including HTML views, PDF and ePub downloads, according to the available data) and Abstracts Views on Vision4Press platform.
Data correspond to usage on the plateform after 2015. The current usage metrics is available 48-96 hours after online publication and is updated daily on week days.
Initial download of the metrics may take a while.