Fig. 2.
Download original image
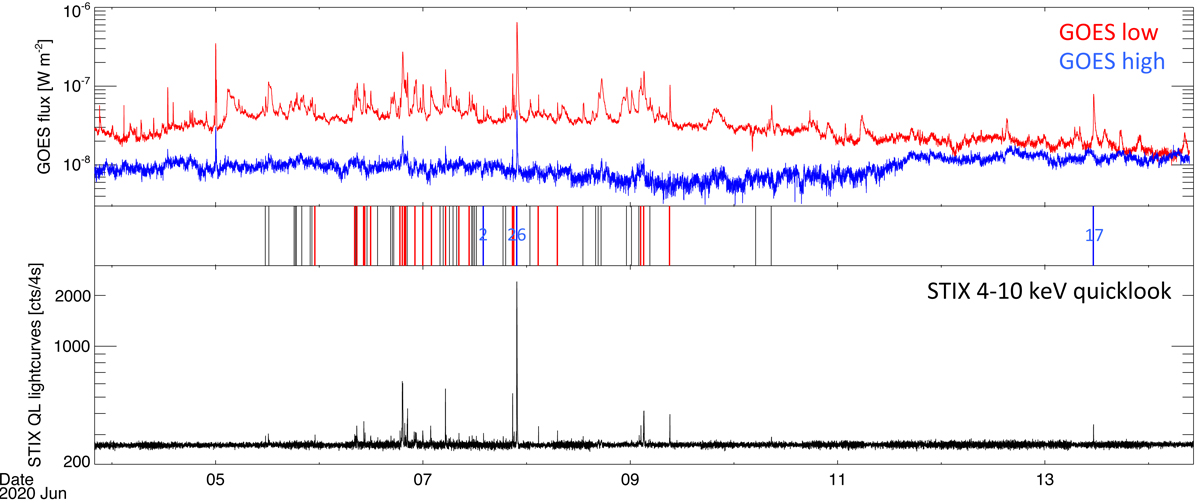
GOES Soft X-ray profiles (top) and STIX 4–10 keV quicklook light curve (bottom) during the time period considered in the paper. The STIX quicklook light curve was used to select 69 flares, which are marked by vertical bars in the central panel. Most of these events were only seen in a single STIX science energy channel (middle, black), and they are therefore difficult to see in the displayed 4–10 keV light curve. For the 26 events which are at multiple STIX science energy bins, flare temperature could be derived (middle, red). The three flares discussed in detail are marked and numbered in blue. We note that all flares are from AR12765, which only became visible from Solar Orbiter after June 5. Hence, flares from earlier times were occulted by the solar limb and not visible by STIX.
Current usage metrics show cumulative count of Article Views (full-text article views including HTML views, PDF and ePub downloads, according to the available data) and Abstracts Views on Vision4Press platform.
Data correspond to usage on the plateform after 2015. The current usage metrics is available 48-96 hours after online publication and is updated daily on week days.
Initial download of the metrics may take a while.