Fig. 11.
Download original image
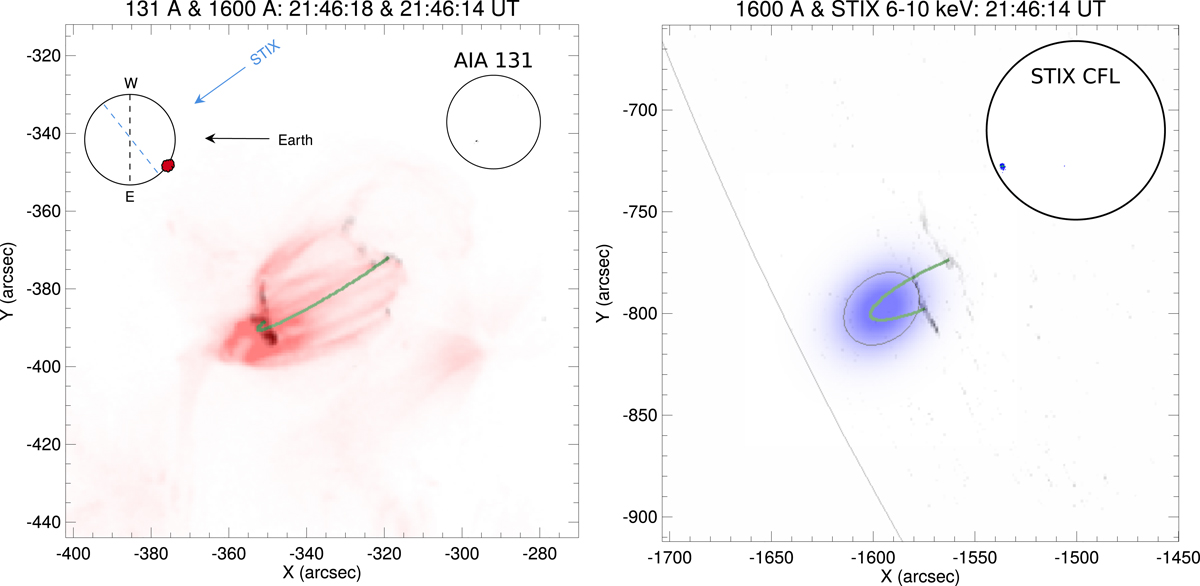
GOES B6 microflare as seen from different vantage points. Left panel: dual color-table including the background subtracted SDO/AIA 131 Å map (red) combined with the 1600 Å map (black) as seen from Earth, which show the flare loops and the flare ribbons, respectively. In order to guide the eye, a semi-circle perpendicular to the solar surface and connecting the flare ribbons is drawn in green. On the top-left corner, a diagram of the different point of views between Earth and STIX is outlined and on top-right the background subtracted full-disk image of the 131 Å map, which highlights the location of the flare. Right panel: a dual color-table is used to show the rotated 1600 Å map (black) and the STIX 6–10 keV image (blue) as seen from the Solar Orbiter vantage point. The green semi-circle is the same as shown in the left figure, but seen from the Solar Orbiter vantage point. In the top-right corner, the location of the flare derived by the STIX Coarse Flare Locator (CFL) is shown. As the phase calibration of the STIX imaging system is not yet completed, the absolute position of the STIX image is not yet known. For now, the STIX thermal source has been positioned to roughly agree with the top of the semi-circle. The position and size of the field of view of the two figures are chosen to show the same projected area on the Sun. The size of the solar disks shown in the inserts, on the other hand, use the same angular scale for both figures.
Current usage metrics show cumulative count of Article Views (full-text article views including HTML views, PDF and ePub downloads, according to the available data) and Abstracts Views on Vision4Press platform.
Data correspond to usage on the plateform after 2015. The current usage metrics is available 48-96 hours after online publication and is updated daily on week days.
Initial download of the metrics may take a while.