Fig. 10.
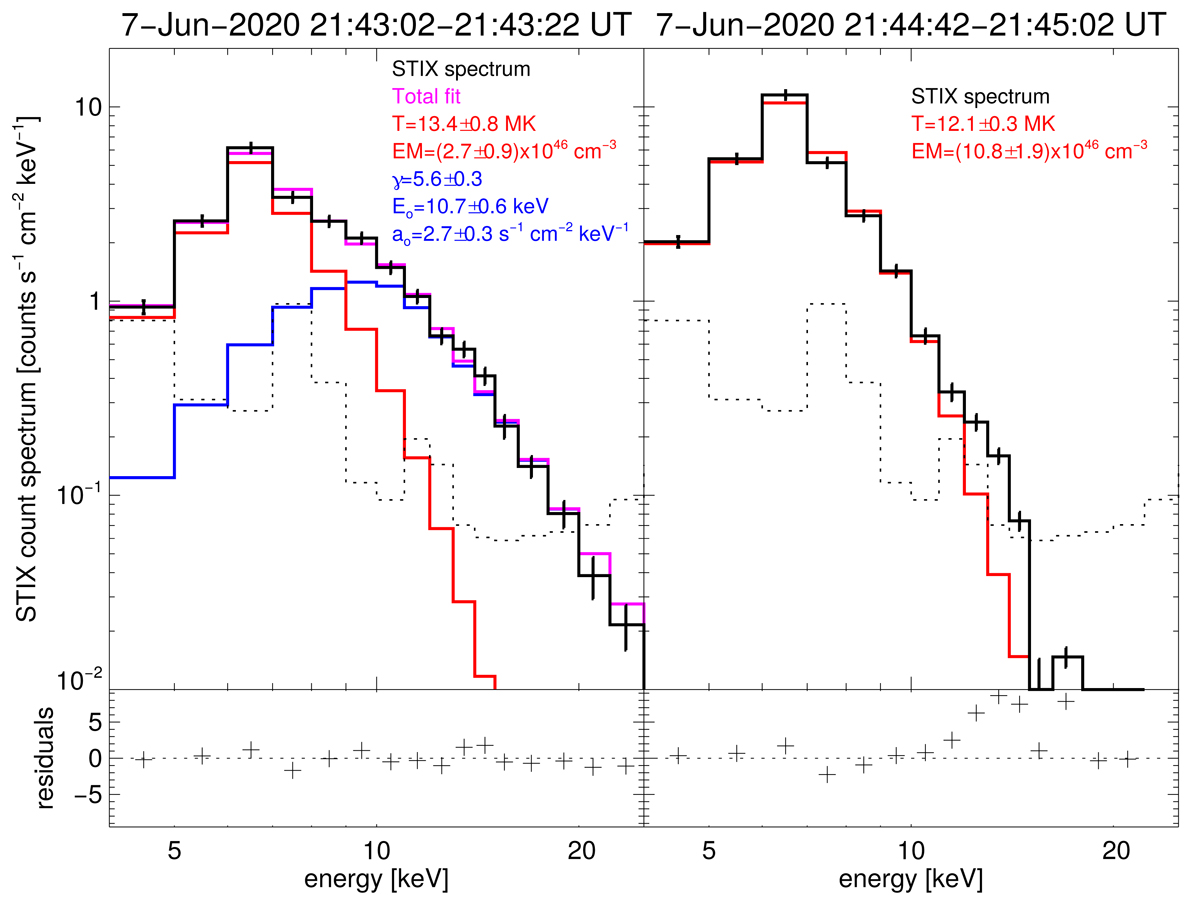
Download original image
Hard X-ray spectroscopy results of the GOES B6 microflare (flare 26) at the nonthermal (left) and thermal (right) peak times. The plots give the background subtracted count spectra in black, with the background shown in black dotted. The colored curves represent the fitted components: thermal in red and nonthermal power-law in blue, while the sum between them in magenta. The bottom panels show the residuals (observations minus fit) in units of the standard deviation calculated from counting statistics and a systematic error of 5% has been added in quadrature to reflect the early stage of the calibration. The impulsive phase (left) is fitted with both, a thermal and nonthermal component, and the combined fit is shown in magenta. The spectra around the thermal peak (right) is only fitted by a thermal, but there is potentially still a faint trace of the nonthermal component visible above 11 keV.
Current usage metrics show cumulative count of Article Views (full-text article views including HTML views, PDF and ePub downloads, according to the available data) and Abstracts Views on Vision4Press platform.
Data correspond to usage on the plateform after 2015. The current usage metrics is available 48-96 hours after online publication and is updated daily on week days.
Initial download of the metrics may take a while.