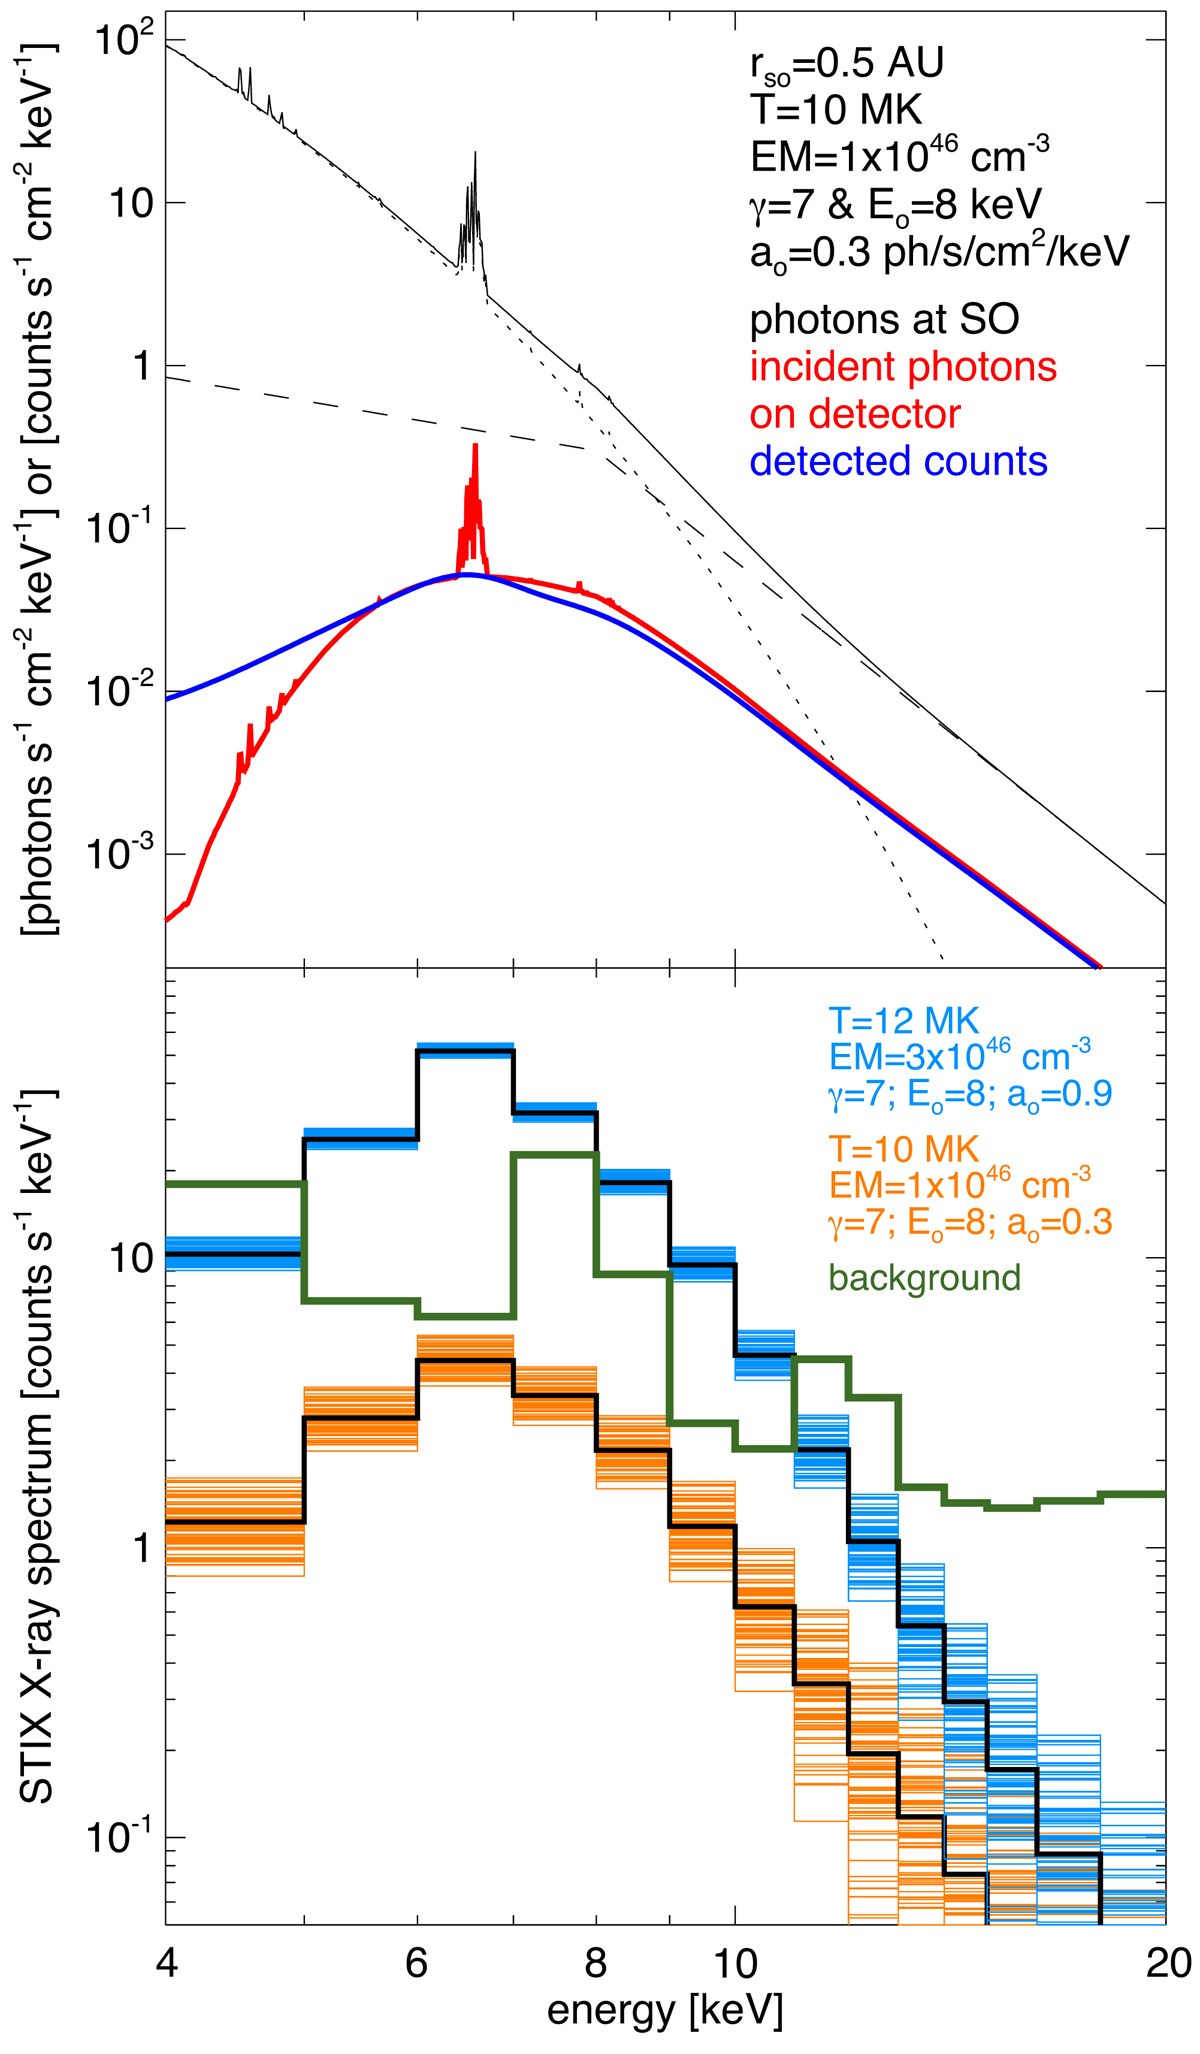
Fig. 1.
Download original image
Simulated STIX instrument response to microflares by assuming an isothermal optically thin source using coronal abundances plus an additional nonthermal tail with a power-law shape and a break energy of the photon spectrum. The simulations were performed for a radial distance from the Sun of 0.5 AU and a flare location at S800″ E1600″ (these parameters roughly correspond to the observations shown in Sect. 3). The top panel shows the arriving photon spectrum at Solar Orbiter (black, with the thermal and nonthermal components shown in dotted and dashed, respectively), the attenuated photon spectrum incident on the STIX detectors (red), and the resulting count spectrum (blue). The bottom panel shows the count spectrum after onboard binning into the STIX science energy channels. The light blue and the orange curves are simulations for two different microflares as given in the annotations. The different histograms in the same color represent different realizations of the counting statistics assuming an integration time of 30 s. The black histograms are the simulations without the noise from counting statistics. The green histogram is the instrumental background that is stable in time and can therefore be measured much more accurately than the microflare count spectra.
Current usage metrics show cumulative count of Article Views (full-text article views including HTML views, PDF and ePub downloads, according to the available data) and Abstracts Views on Vision4Press platform.
Data correspond to usage on the plateform after 2015. The current usage metrics is available 48-96 hours after online publication and is updated daily on week days.
Initial download of the metrics may take a while.