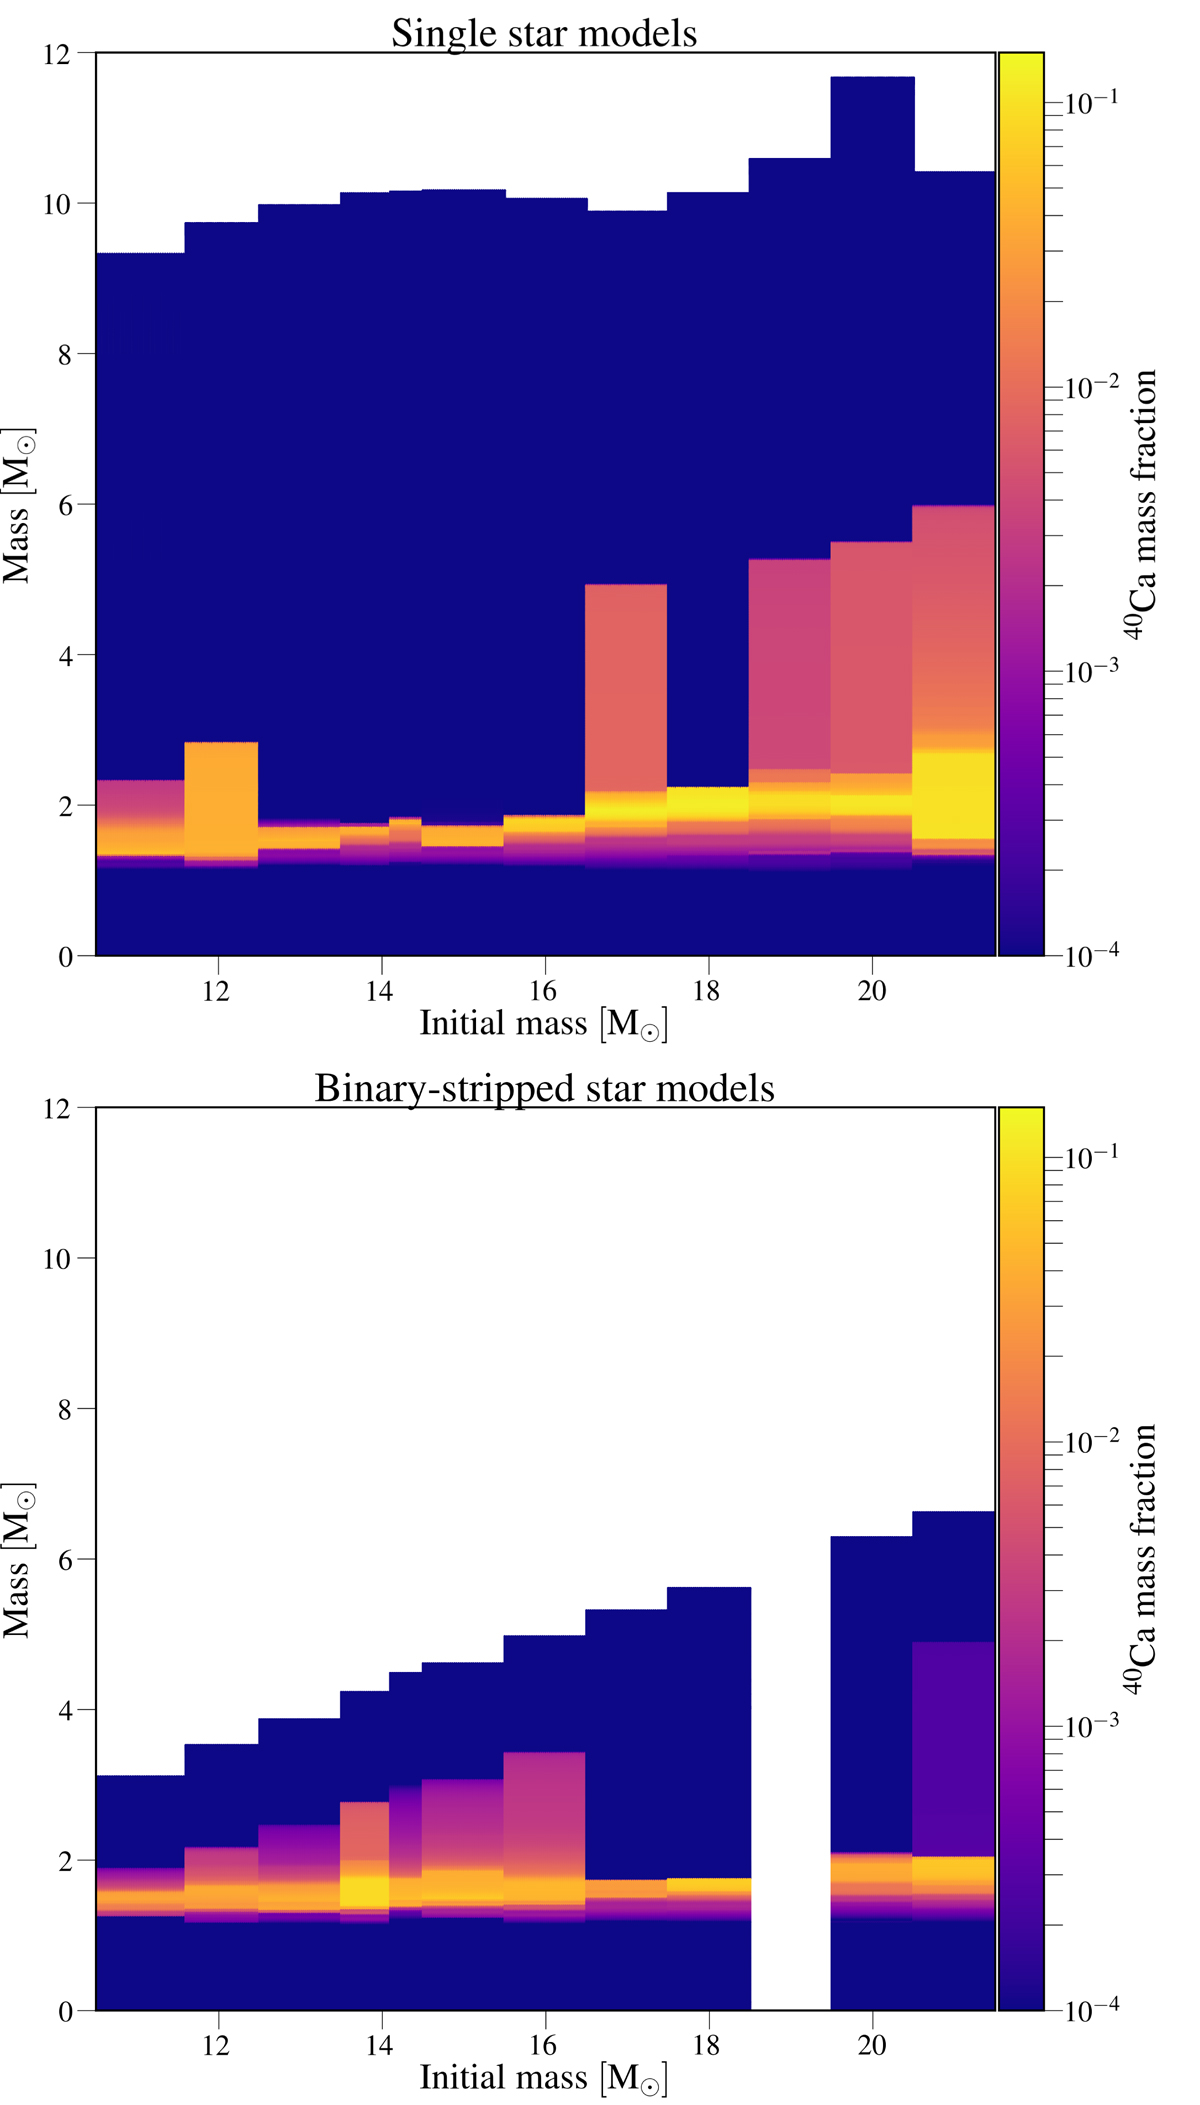
Fig. 4.
Download original image
Distribution of 40Ca in the interior of all stellar models as a function of their mass (top: single stellar models; bottom: binary-stripped stars). All models, represented as bars, are shown as a function of their initial mass. The length of each bar gives the mass of this model at the onset of core collapse. The binary-stripped star model with an initial mass of 19 M⊙ is not shown because it did not reach core collapse due to numerical issues.
Current usage metrics show cumulative count of Article Views (full-text article views including HTML views, PDF and ePub downloads, according to the available data) and Abstracts Views on Vision4Press platform.
Data correspond to usage on the plateform after 2015. The current usage metrics is available 48-96 hours after online publication and is updated daily on week days.
Initial download of the metrics may take a while.