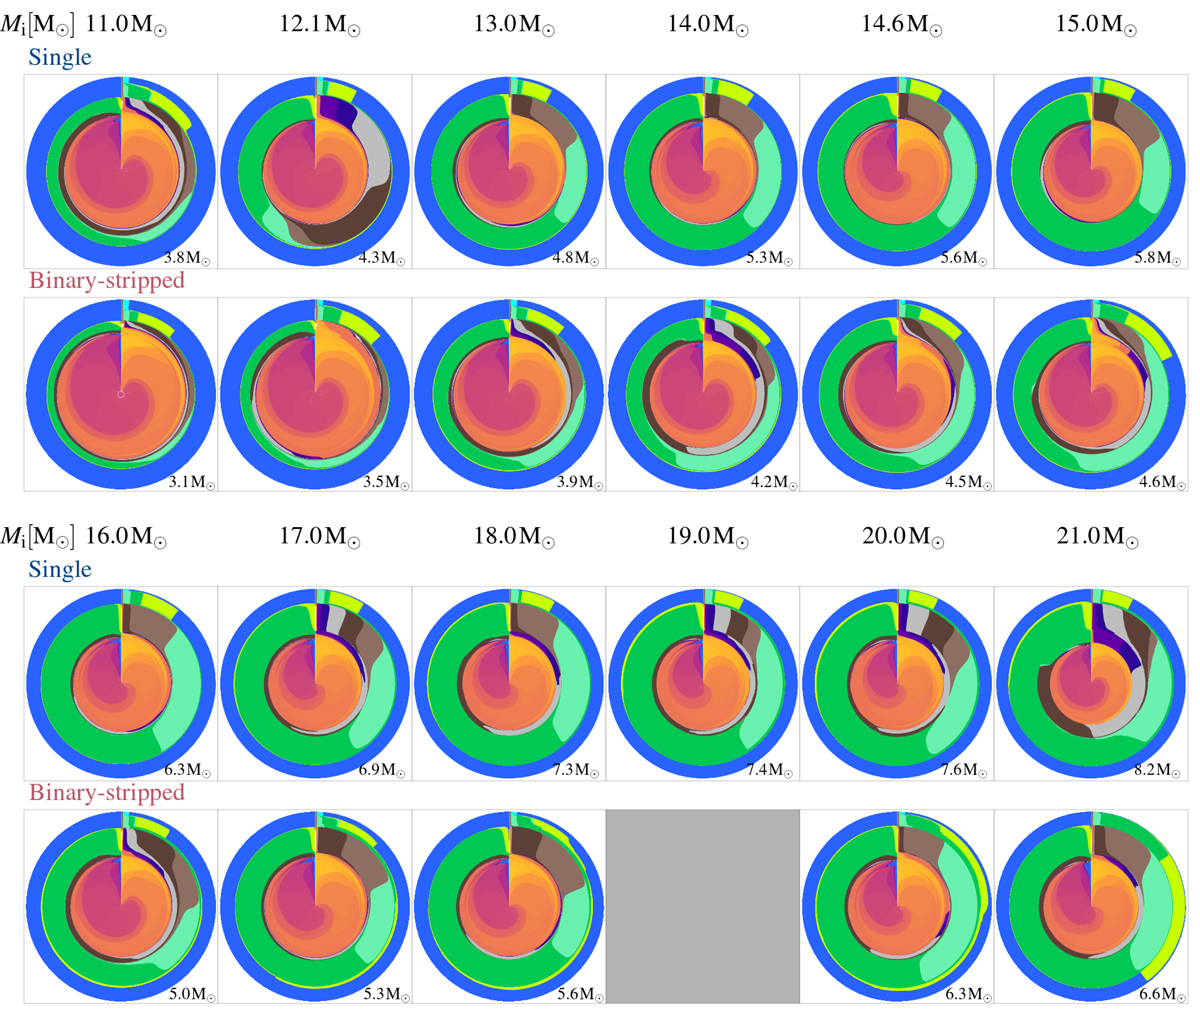
Fig. C.1.
Download original image
Composition diagrams showing the core composition inside the helium core at the onset of core collapse for the entire grid of models. The two pairs of rows show single and binary-stripped star models with the same initial masses. All models are scaled such that the radius of the diagram is proportional to the square root of the helium core mass (the helium core mass is indicated at the bottom of each diagram). The binary-stripped model with an initial mass of 19 M⊙ is not shown because it did not reach core collapse. Colors represent the same isotopes as in Fig. 2.
Current usage metrics show cumulative count of Article Views (full-text article views including HTML views, PDF and ePub downloads, according to the available data) and Abstracts Views on Vision4Press platform.
Data correspond to usage on the plateform after 2015. The current usage metrics is available 48-96 hours after online publication and is updated daily on week days.
Initial download of the metrics may take a while.