Fig. 11.
Download original image
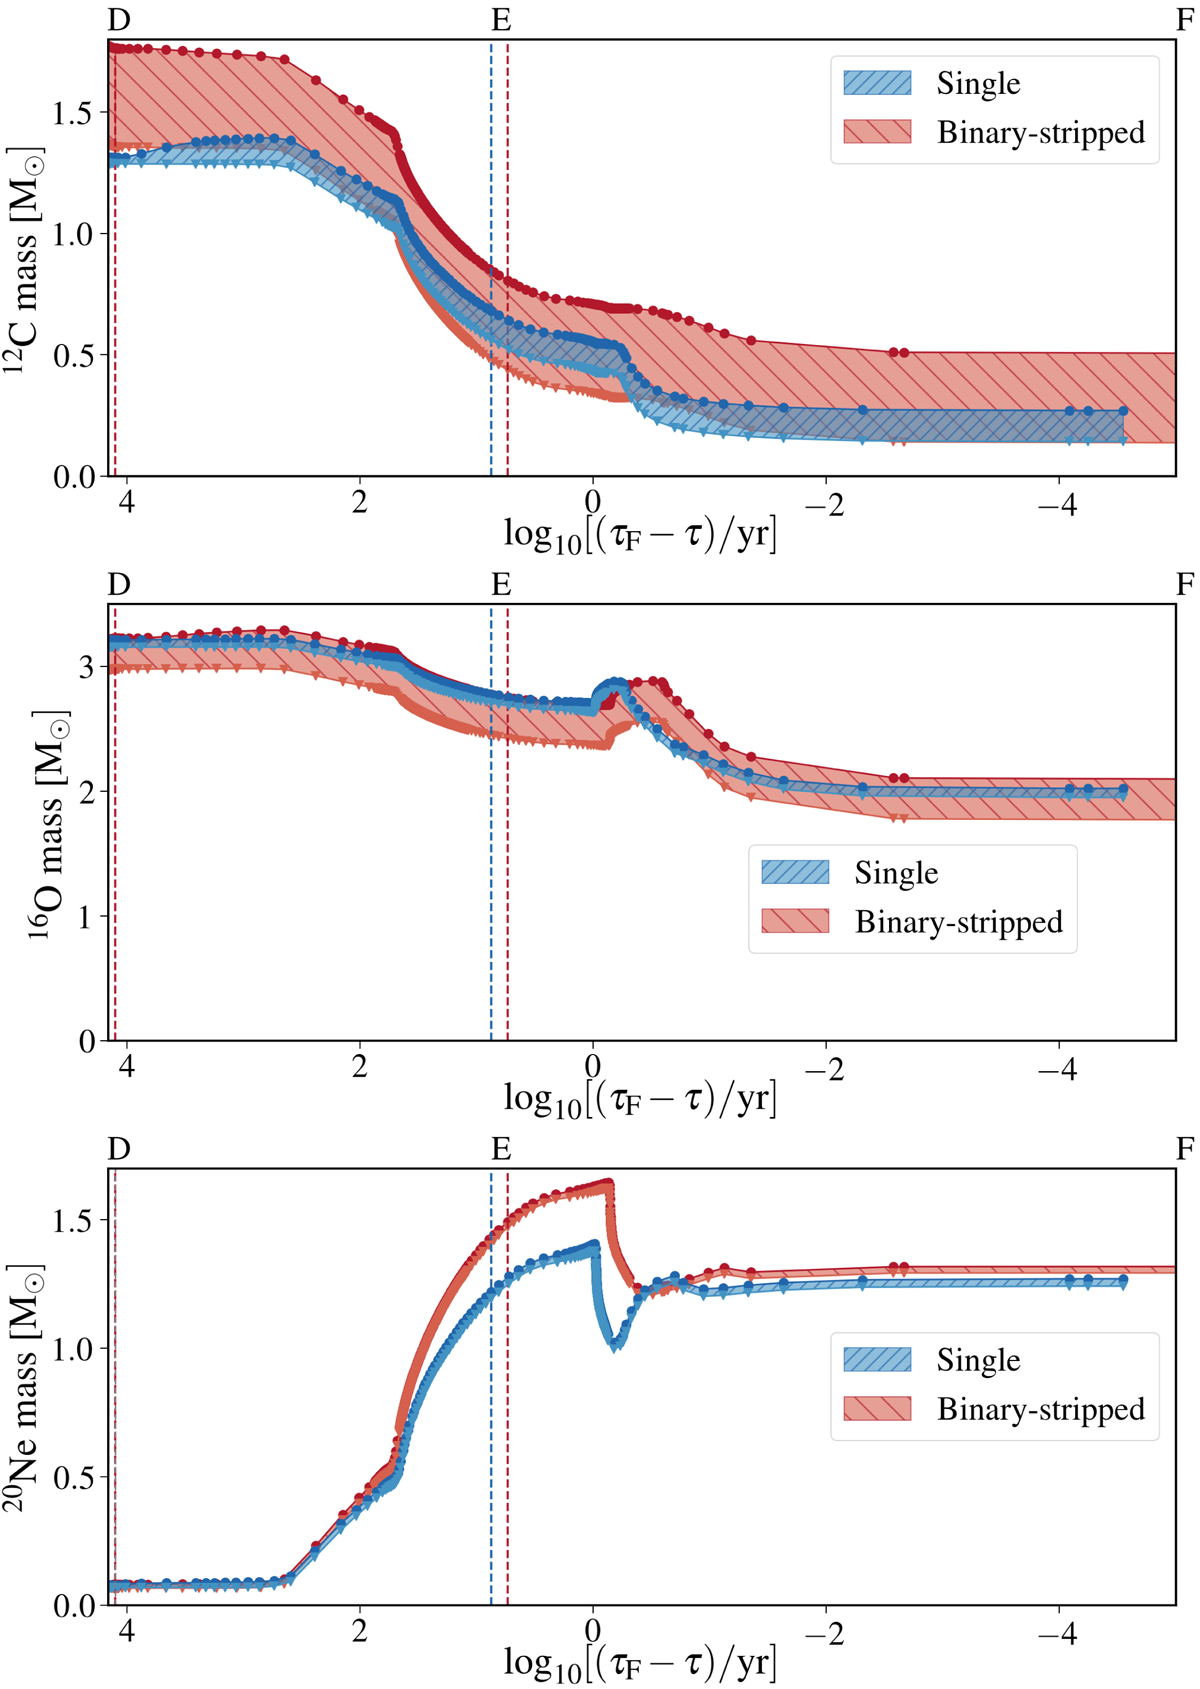
Evolution of the total mass of 12C (top), 16O (middle), 20Ne (bottom) for a single (blue) and a binary-stripped star model (red) with the same reference core mass of 6.3 M⊙. The evolution is shown from the moment of core helium depletion as a function of the time until core oxygen depletion. The curve marked by inverted triangles (i.e., the lower boundary of the colored bands in each plot) indicates the total mass of each isotope inside the helium-depleted core. The upper boundary marked by circles shows the total mass of this isotope in the star. The red and blue shaded regions thus highlight the mass of this isotope in the shell above the core.
Current usage metrics show cumulative count of Article Views (full-text article views including HTML views, PDF and ePub downloads, according to the available data) and Abstracts Views on Vision4Press platform.
Data correspond to usage on the plateform after 2015. The current usage metrics is available 48-96 hours after online publication and is updated daily on week days.
Initial download of the metrics may take a while.