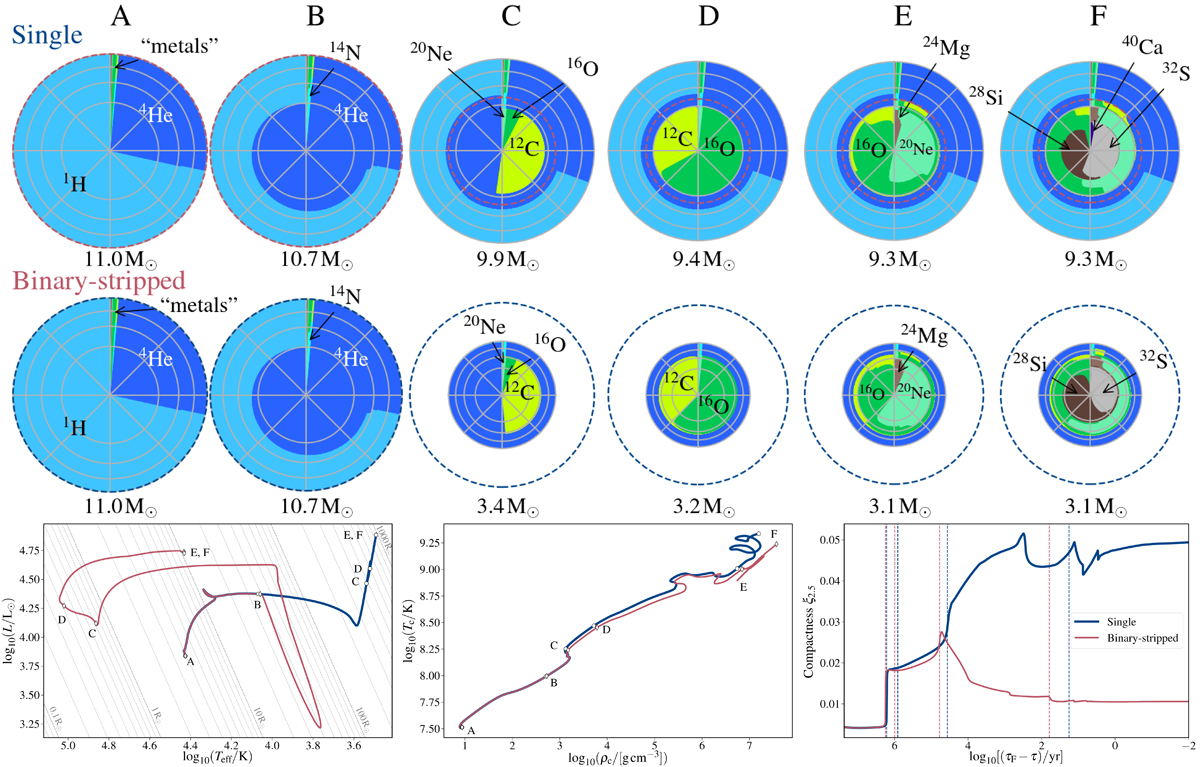
Fig. 1.

Download original image
Evolution of example single (blue) and binary-stripped star (red) models with the same initial mass of 11 M⊙ until core oxygen depletion. Key moments of the evolution, discussed in Sect. 3, are marked with letters A to F. Upper panels: chemical structure of the single star (top) and the donor star in a binary system (binary-stripped star, bottom) with the same initial mass of 11 M⊙ at key moments of the evolution. The radial direction is proportional to the square root of the total mass of the model (see text). The total mass is given below each model. Colors indicate the local mass fraction of each isotope. The surface area spanned by each element is proportional to its total mass. The diagrams are divided into concentric rings. Each ring is a pie chart of the most abundant isotopes in the models. From the outside moving inward, gray circles mark regions containing 100, 75, 50, and 25 percent of the total mass, respectively. Lines are placed at equal intervals of one-eighth of the total fraction of isotopes. To aid the comparison, dashed blue or red circles indicate the total mass of the alternate model (single or binary-stripped) at the same stage. The neon isotope labeled in panel C would be 22Ne in reality and is only 20Ne as an artifact of the approx21 network. Likewise, for these relatively low-mass models, the isotope distribution at the end of core oxygen burning (panel F) is significantly affected by the simplifications of approx21. Bottom panels: evolution of the single (blue) and binary-stripped (red) models in the HR diagram (left) and the central density – central temperature (center) plane. Circles and diamonds mark important evolutionary steps for the single and binary-stripped star model, respectively. We also show the evolution of the compactness parameter (right) as a function of the time until core oxygen depletion. Vertical dashed lines mark important evolutionary steps.
Current usage metrics show cumulative count of Article Views (full-text article views including HTML views, PDF and ePub downloads, according to the available data) and Abstracts Views on Vision4Press platform.
Data correspond to usage on the plateform after 2015. The current usage metrics is available 48-96 hours after online publication and is updated daily on week days.
Initial download of the metrics may take a while.


