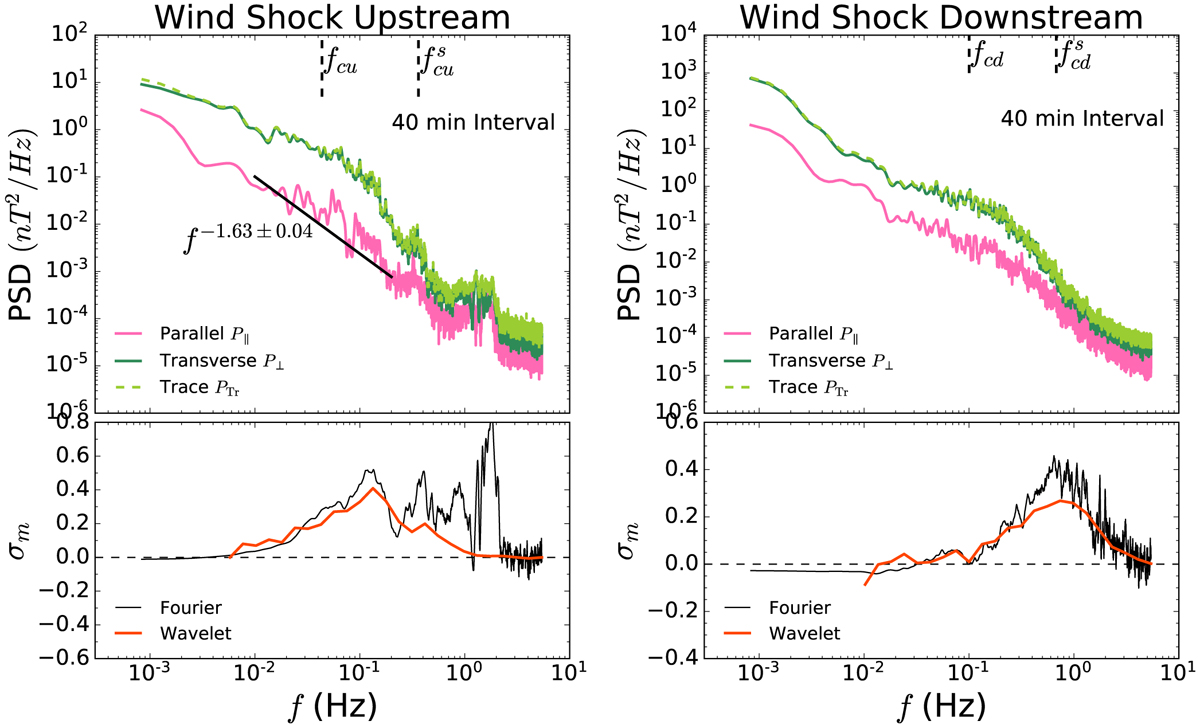
Fig. 9.
Download original image
Decomposition of the total magnetic field fluctuations into parallel and transverse fluctuations. In the same format as Fig. 7, but for Wind observations. Top panels: upstream (left) and downstream (right) power spectra of the total magnetic fluctuations (limegreen dashed lines), compressible fluctuations (pink solid lines), and incompressible traverse fluctuations (green lines). Bottom panels: spectra of normalized magnetic helicity σm obtained from both Fourier and Wavelet methods.
Current usage metrics show cumulative count of Article Views (full-text article views including HTML views, PDF and ePub downloads, according to the available data) and Abstracts Views on Vision4Press platform.
Data correspond to usage on the plateform after 2015. The current usage metrics is available 48-96 hours after online publication and is updated daily on week days.
Initial download of the metrics may take a while.