Fig. 8.
Download original image
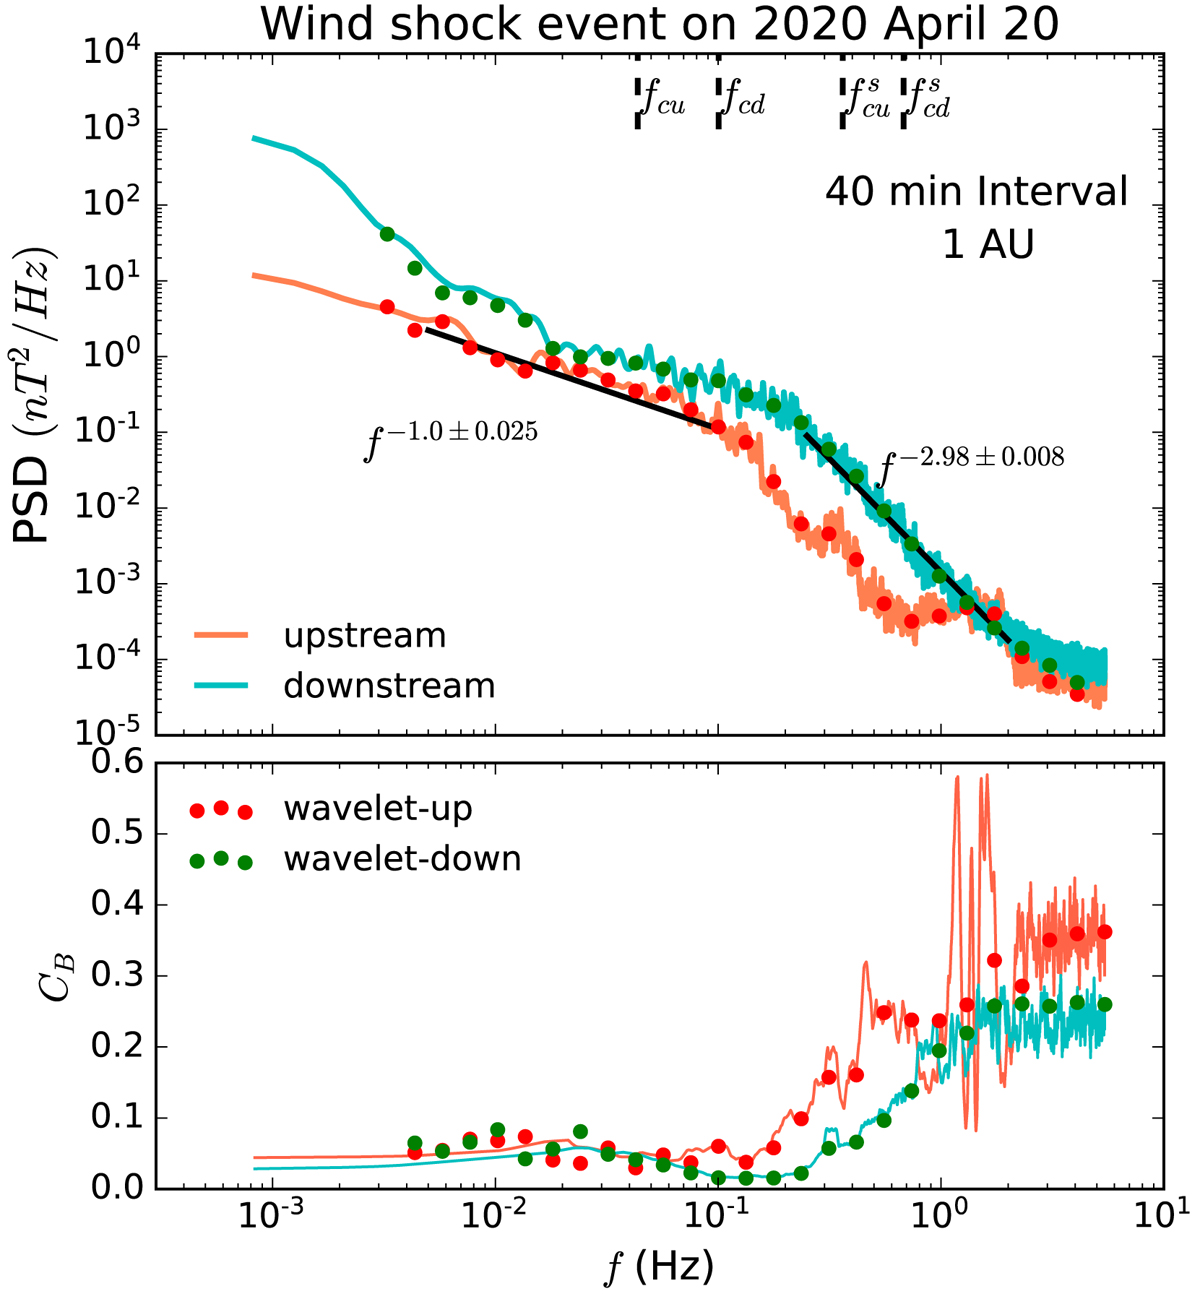
Trace spectra of magnetic field fluctuations and magnetic compressibility. In the same format as Fig. 6, but for Wind observations upstream and downstream of the shock. Vertical dashed lines in the top panel indicate the proton cyclotron frequency in the plasma frame upstream fcu and downstream fcd and in the spacecraft frame upstream ![]() and downstream
and downstream ![]() , respectively. Black solid lines in the top panel show the power-law fits. The power spectra and compressibility CB are calculated within a 40-min interval.
, respectively. Black solid lines in the top panel show the power-law fits. The power spectra and compressibility CB are calculated within a 40-min interval.
Current usage metrics show cumulative count of Article Views (full-text article views including HTML views, PDF and ePub downloads, according to the available data) and Abstracts Views on Vision4Press platform.
Data correspond to usage on the plateform after 2015. The current usage metrics is available 48-96 hours after online publication and is updated daily on week days.
Initial download of the metrics may take a while.