Fig. 6.
Download original image
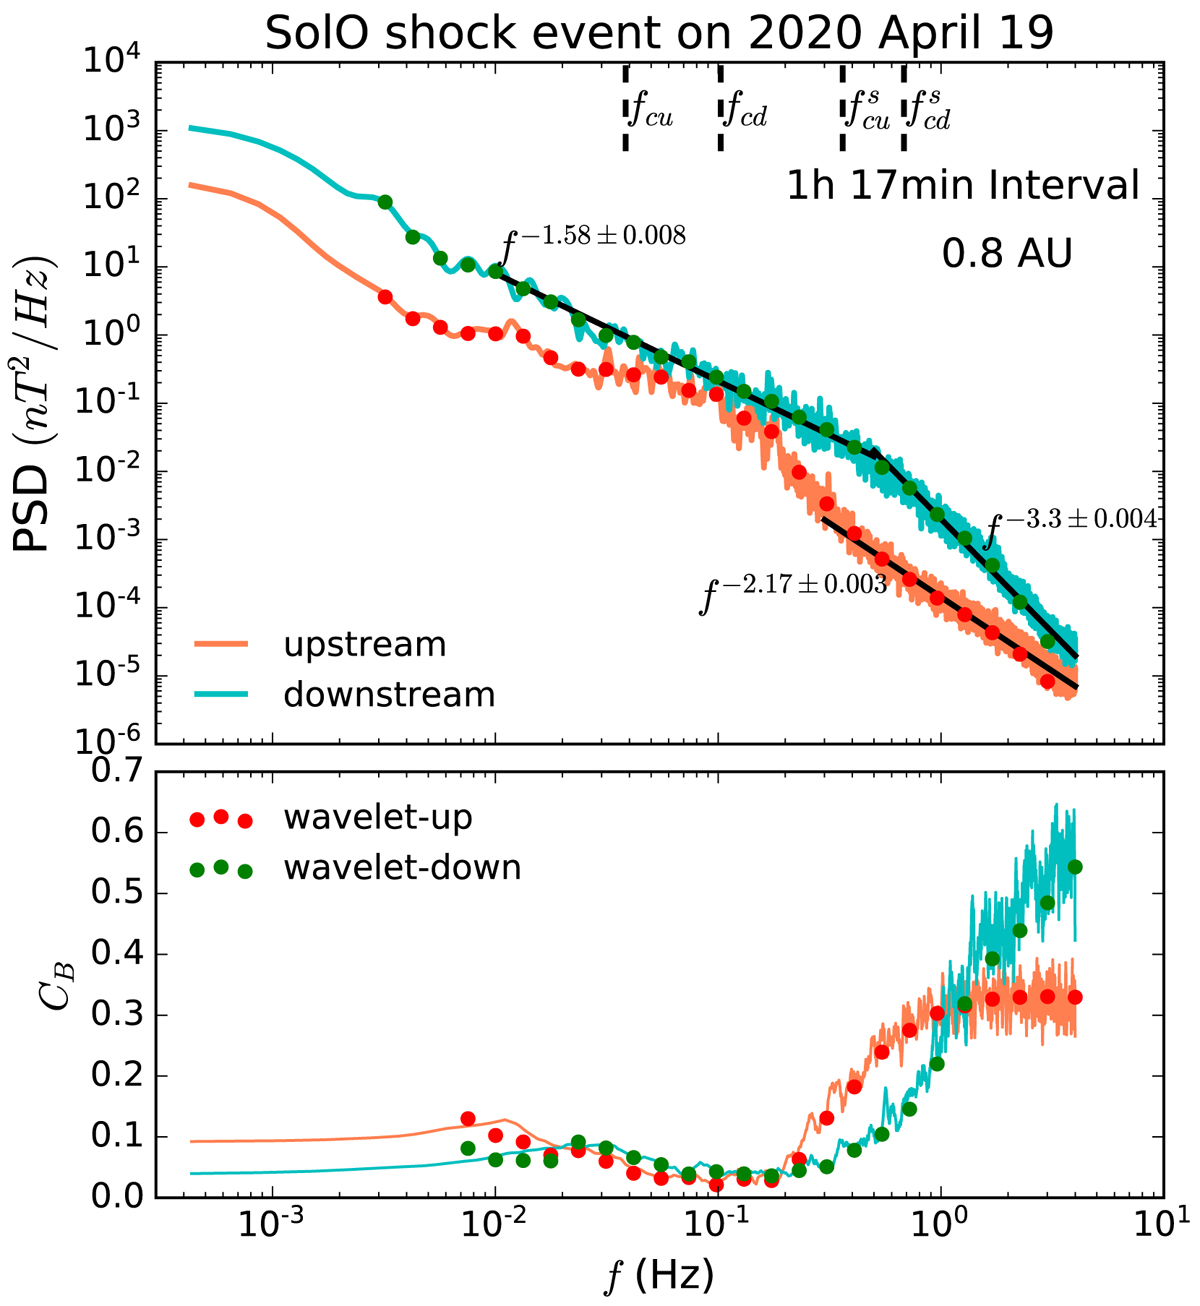
Solar Orbiter’s total magnetic field power spectra density (top panel) and magnetic comressibility CB (bottom panel) as a function of frequency upstream and downstream of the shock. The red and turquoise lines represent the upstream and downstream Fourier spectra using the Blackman-Tukey method. The red and green dots represent the corresponding Morlet wavelet results. Each spectrum is calculated in a 77-min interval upstream and downstream, respectively. Black straight lines in the top panel show power-law fits, and vertical dashed lines indicate the upstream and downstream proton cyclotron frequency in the plasma frame fcu, fcd and in the spacecraft frame ![]() ,
, ![]() .
.
Current usage metrics show cumulative count of Article Views (full-text article views including HTML views, PDF and ePub downloads, according to the available data) and Abstracts Views on Vision4Press platform.
Data correspond to usage on the plateform after 2015. The current usage metrics is available 48-96 hours after online publication and is updated daily on week days.
Initial download of the metrics may take a while.