Open Access
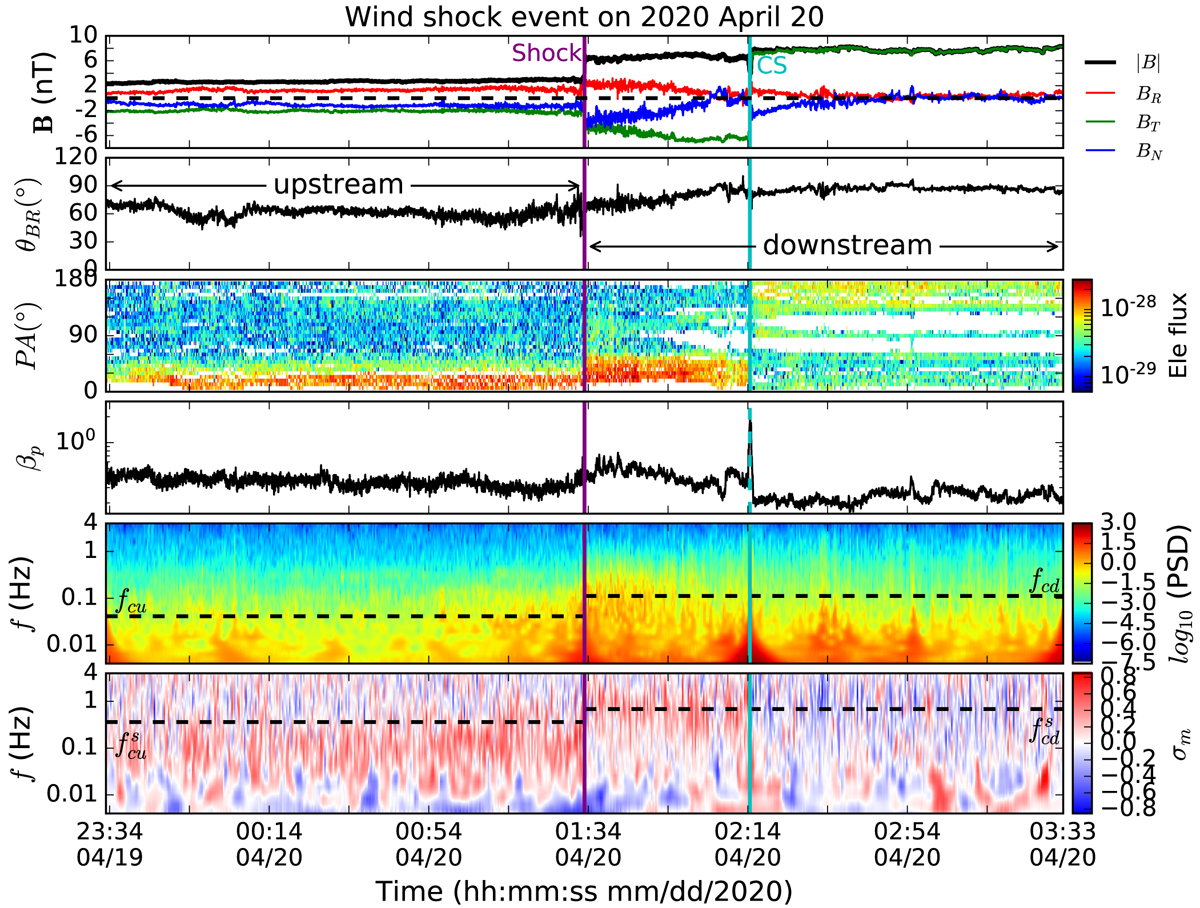
Fig. 5.
Download original image
Wind observation near the shock. In the same format as Fig. 4. Third panel shows the pitch angle distribution of 97.37 eV electrons, and the fourth panel shows the proton plasma beta during this period. The cyan vertical lines represent the current sheet crossing.
Current usage metrics show cumulative count of Article Views (full-text article views including HTML views, PDF and ePub downloads, according to the available data) and Abstracts Views on Vision4Press platform.
Data correspond to usage on the plateform after 2015. The current usage metrics is available 48-96 hours after online publication and is updated daily on week days.
Initial download of the metrics may take a while.