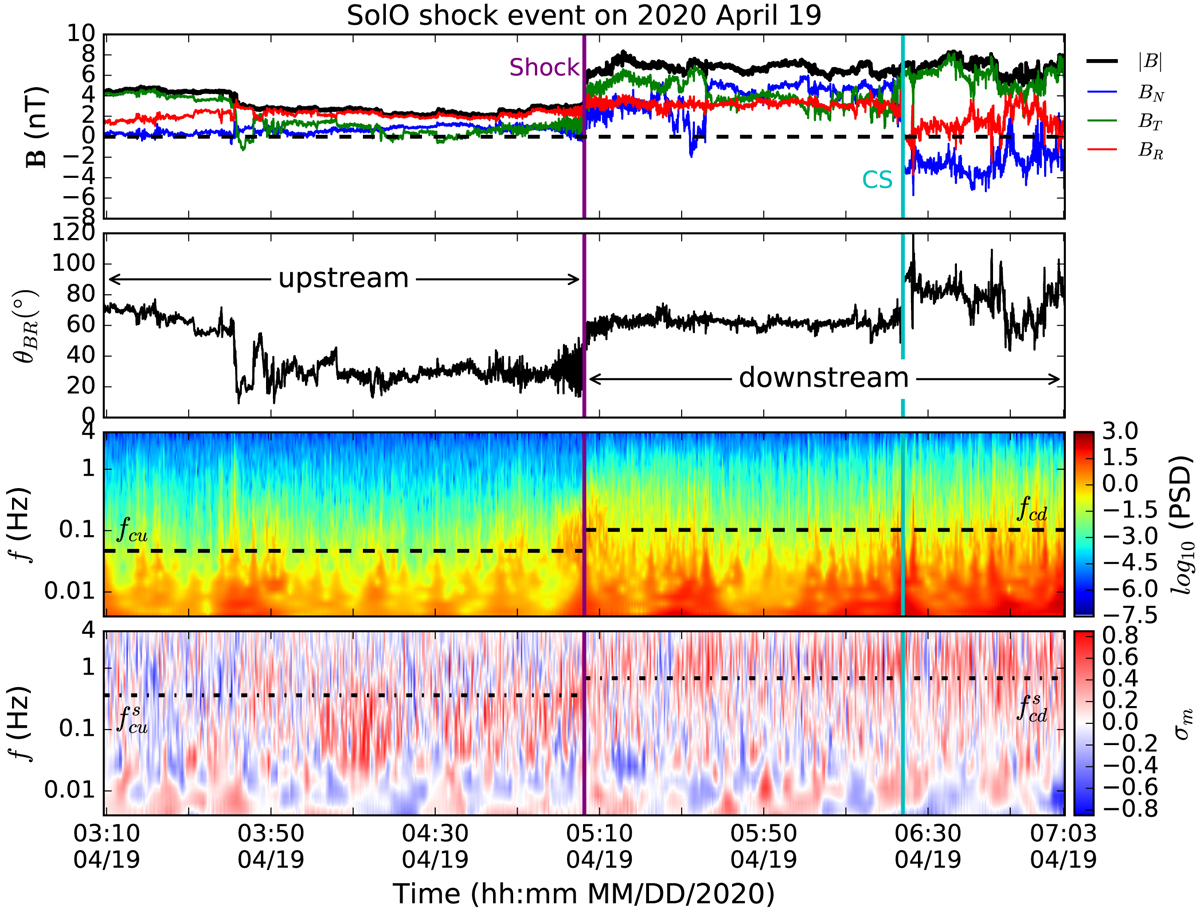
Fig. 4.
Download original image
Solar Orbiter observation near the shock. Panels from top to bottom show the magnetic field components and magnitude, the angle θBR between the magnetic field and radial direction, the total magnetic field power spectral density (PSD), and the normalized magnetic helicity σm from the Morlet wavelet analysis. The cyan vertical line in each panel represents the current sheet crossing. The horizontal dashed lines in the third panel identify the proton cyclotron frequency in the plasma frame upstream fcu and downstream fcd. The dashed dotted lines in the fourth panel shows the equivalent frequency in the spacecraft frame ![]() and
and ![]() based on Wind’s plasma measurements.
based on Wind’s plasma measurements.
Current usage metrics show cumulative count of Article Views (full-text article views including HTML views, PDF and ePub downloads, according to the available data) and Abstracts Views on Vision4Press platform.
Data correspond to usage on the plateform after 2015. The current usage metrics is available 48-96 hours after online publication and is updated daily on week days.
Initial download of the metrics may take a while.