Open Access
Fig. 13.
Download original image
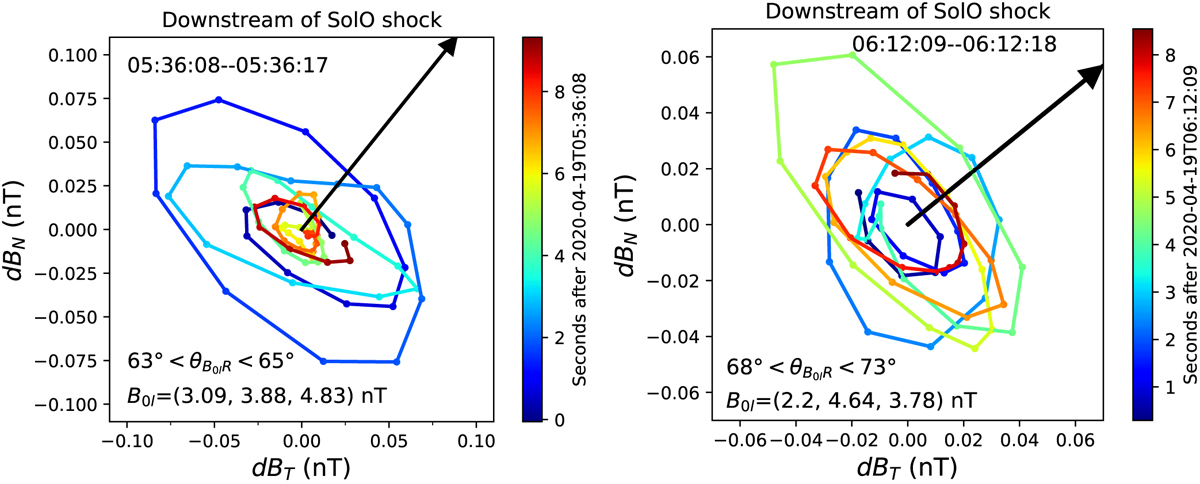
Magnetic hodograms in the same format as Fig. 12, but for Solar Orbiter observations downstream of the shock. The wavelet reconstructed magnetic field fluctuations dBT and dBN are averaged over the period range [0.5, 2] s. The black arrow indicates the direction of the local mean magnetic field B0l.
Current usage metrics show cumulative count of Article Views (full-text article views including HTML views, PDF and ePub downloads, according to the available data) and Abstracts Views on Vision4Press platform.
Data correspond to usage on the plateform after 2015. The current usage metrics is available 48-96 hours after online publication and is updated daily on week days.
Initial download of the metrics may take a while.