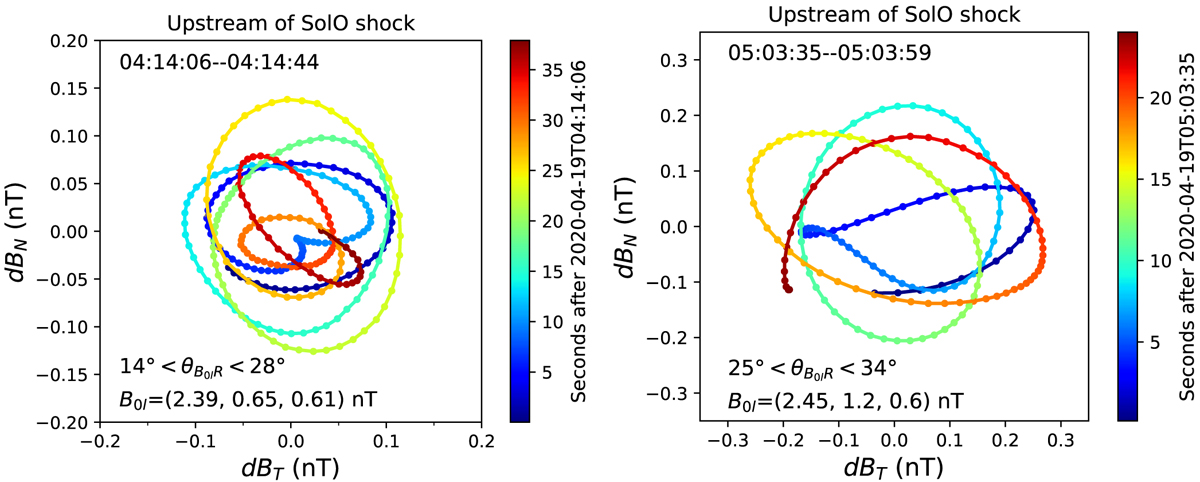
Fig. 12.
Download original image
Two cases of the dBT–dBN hodograms observed by the Solar Orbiter upstream of the shock. The magnetic field fluctuations dBT and dBN are reconstructed from the wavelet transform by averaging in the period range [3, 8] s. The first case is selected in the time interval between 04:14:06 UT and 04:14:44 UT on 2020 April 19 when 14° < θkB < 28°. The second case is selected in the time interval between 05:03:35 UT and 05:03:59 UT on 2020 April 19 when 22° < θkB < 34°. B0l is the local mean magnetic field averaged in the selected period range and time interval.
Current usage metrics show cumulative count of Article Views (full-text article views including HTML views, PDF and ePub downloads, according to the available data) and Abstracts Views on Vision4Press platform.
Data correspond to usage on the plateform after 2015. The current usage metrics is available 48-96 hours after online publication and is updated daily on week days.
Initial download of the metrics may take a while.