Fig. 2.
Download original image
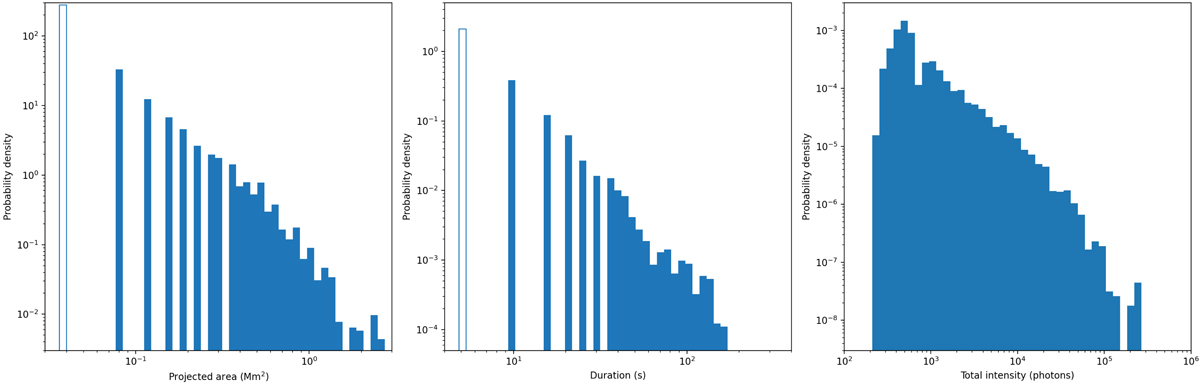
Observed event distribution as a function of projected area, duration, and total intensity. Projected area refers to all the pixel area that the events occupy at some stage over their duration. The probability density is scaled such that when integrated over all bin widths, the total event count of 1467 is obtained. The smallest areas and durations (only one pixel or one exposure) are displayed as bars without filling.
Current usage metrics show cumulative count of Article Views (full-text article views including HTML views, PDF and ePub downloads, according to the available data) and Abstracts Views on Vision4Press platform.
Data correspond to usage on the plateform after 2015. The current usage metrics is available 48-96 hours after online publication and is updated daily on week days.
Initial download of the metrics may take a while.