Open Access
Fig. 9.
Download original image
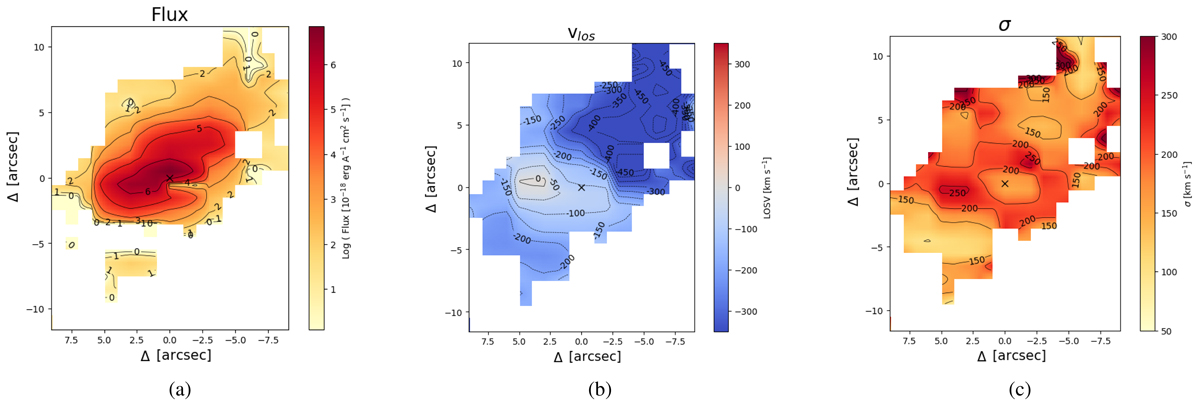
[OIII]λ5008 emission in NGC7319; map orientation as in Fig. 5. The cross marks the stellar continuum peak emission, set as the centre of the galaxy. The 0 line-of-sight velocity is that of the central 1.5″ of the stellar velocity field. (a) Flux. (b) Line-of-sight velocity. (c) Velocity dispersion.
Current usage metrics show cumulative count of Article Views (full-text article views including HTML views, PDF and ePub downloads, according to the available data) and Abstracts Views on Vision4Press platform.
Data correspond to usage on the plateform after 2015. The current usage metrics is available 48-96 hours after online publication and is updated daily on week days.
Initial download of the metrics may take a while.