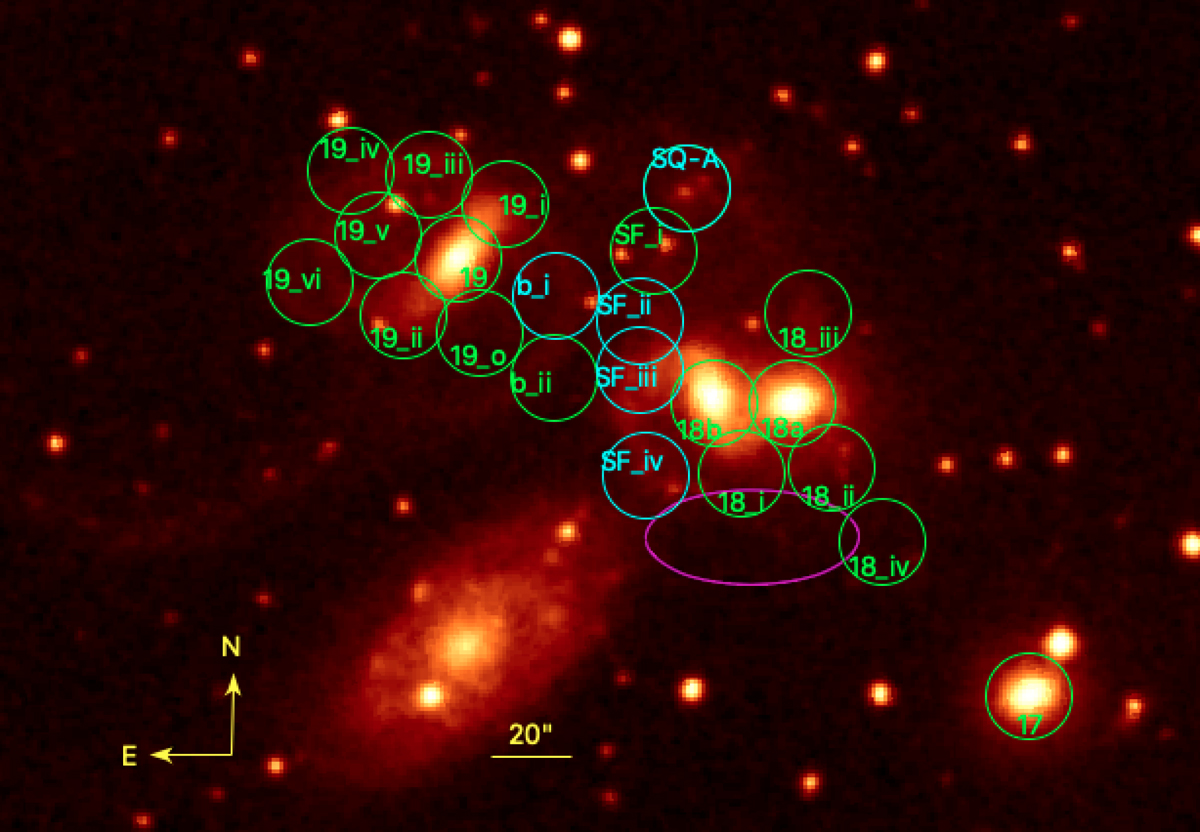
Fig. 7.
Download original image
Our 22 regions, with an 11″ radius, chosen for closer CO analysis on a DSS2 red image, marked by green and cyan circles. The magenta ellipse is discussed in Sect. 3.6. The cyan regions coincide with the single beam IRAM 30m observations carried out by Guillard et al. (2012). The naming convention of the regions is within each circle, and the RA Dec of each region is listed in Appendix C.
Current usage metrics show cumulative count of Article Views (full-text article views including HTML views, PDF and ePub downloads, according to the available data) and Abstracts Views on Vision4Press platform.
Data correspond to usage on the plateform after 2015. The current usage metrics is available 48-96 hours after online publication and is updated daily on week days.
Initial download of the metrics may take a while.