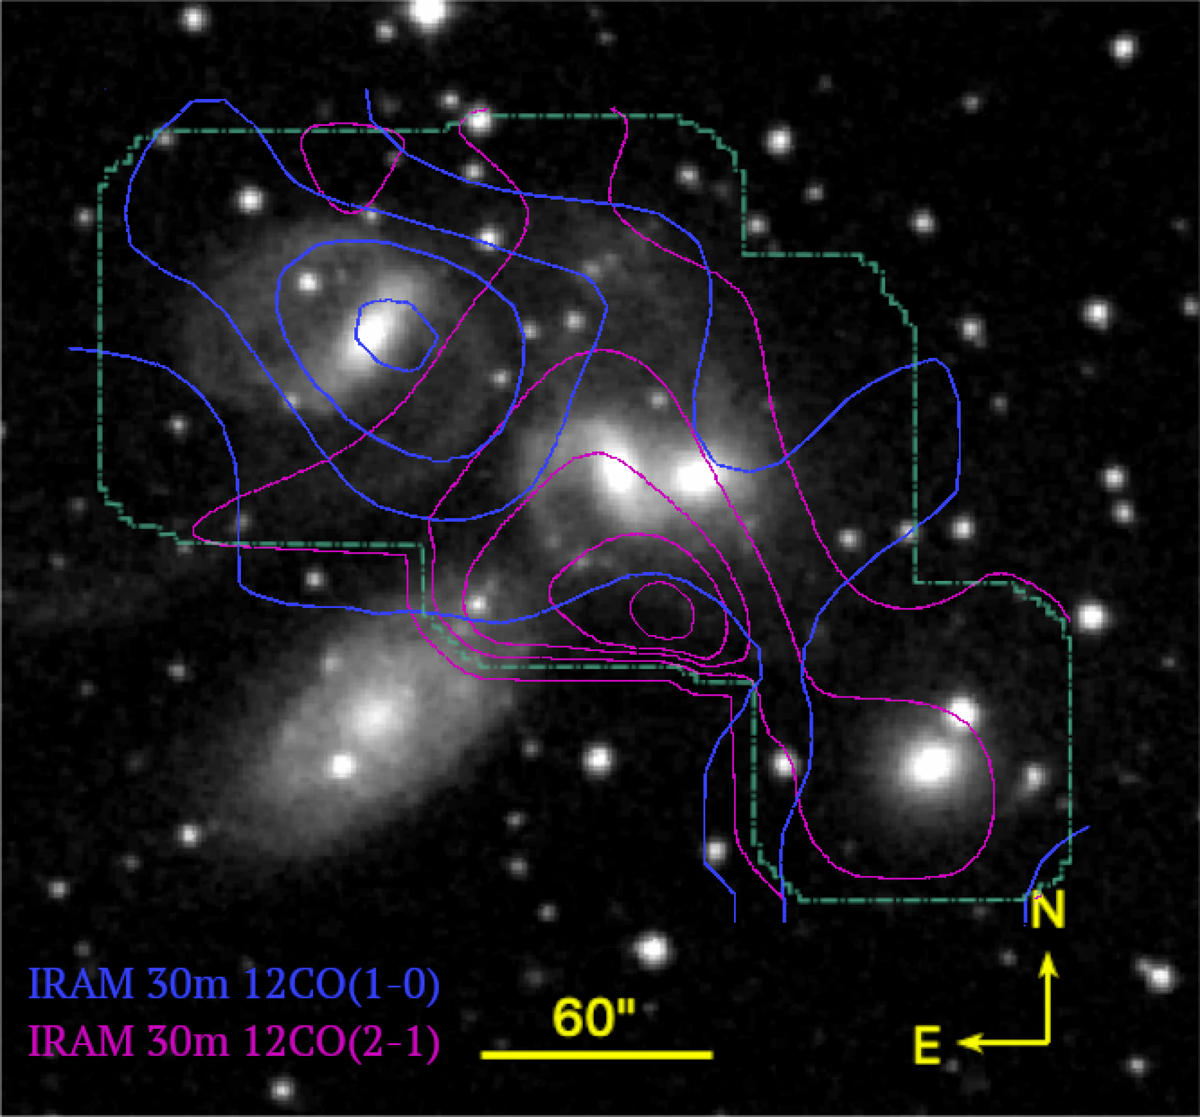
Fig. 6.
Download original image
Contours of the CO emission summed over 5100 − 7500 km s−1 per spaxel, as displayed separately in Appendix E, for the 12CO (1 − 0) line (contours at 4, 35, 50, and 70 mK) and the 12CO (2 − 1) line (contours at 4, 80, 120, 140, and 160 mK), overlaid on a DSS2 R-band image. The green outline shows the edge of the observed area (the extension of the contours beyond this outline is artificial).
Current usage metrics show cumulative count of Article Views (full-text article views including HTML views, PDF and ePub downloads, according to the available data) and Abstracts Views on Vision4Press platform.
Data correspond to usage on the plateform after 2015. The current usage metrics is available 48-96 hours after online publication and is updated daily on week days.
Initial download of the metrics may take a while.