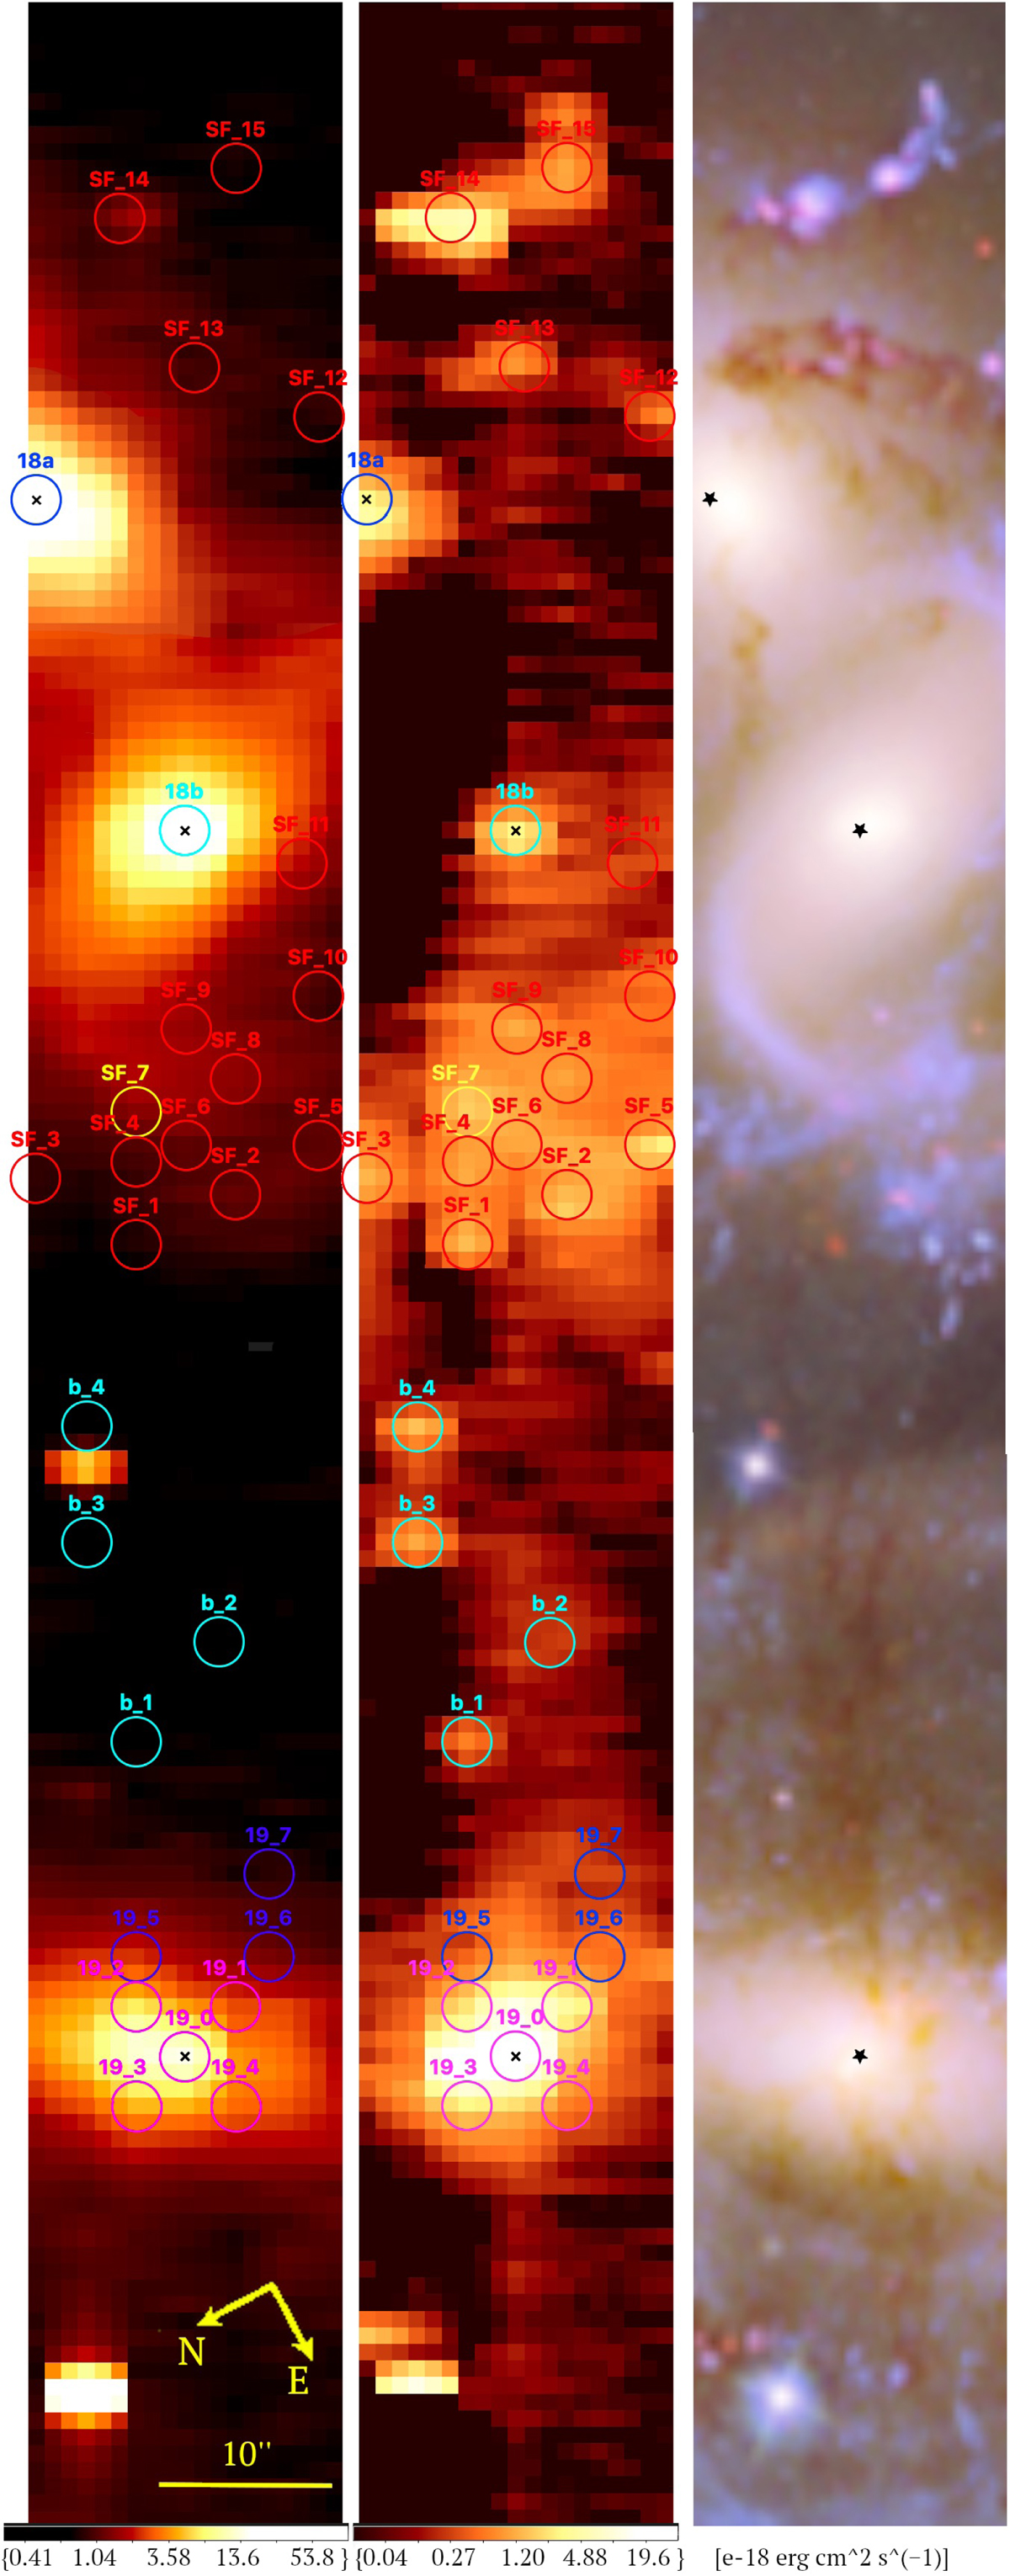
Fig. 5.

Download original image
Left: stellar continuum image constructed from the LBT data with the regions marked for closer analysis. The right ascension (RA) and declination (Dec) of each region is listed in Appendix C. Middle: emission of the Hα_[N II] sub-band observed with the LBT, which provides the basis of the choice of regions. Right: observed area as imaged by a Subaru telescope and a Hubble Space Telescope WFC3 composite colour image (based on the image processed by Robert Gendler and Judy Schmidt).
Current usage metrics show cumulative count of Article Views (full-text article views including HTML views, PDF and ePub downloads, according to the available data) and Abstracts Views on Vision4Press platform.
Data correspond to usage on the plateform after 2015. The current usage metrics is available 48-96 hours after online publication and is updated daily on week days.
Initial download of the metrics may take a while.


