Open Access
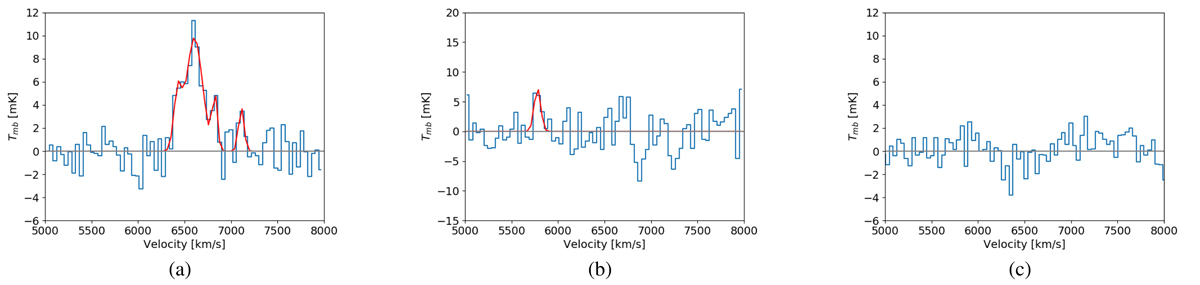
Fig. F.1.
Download original image
Spectra of the CO emission extracted using an HPBW of a 22″ diameter from the smoothed maps (i.e. the central 11″) of NGC7319, region 19. The fitted lines are in red. (a) 12CO (1 − 0) line. (b) 12CO (2 − 1) line. (c) 13CO (1 − 0) line.
Current usage metrics show cumulative count of Article Views (full-text article views including HTML views, PDF and ePub downloads, according to the available data) and Abstracts Views on Vision4Press platform.
Data correspond to usage on the plateform after 2015. The current usage metrics is available 48-96 hours after online publication and is updated daily on week days.
Initial download of the metrics may take a while.