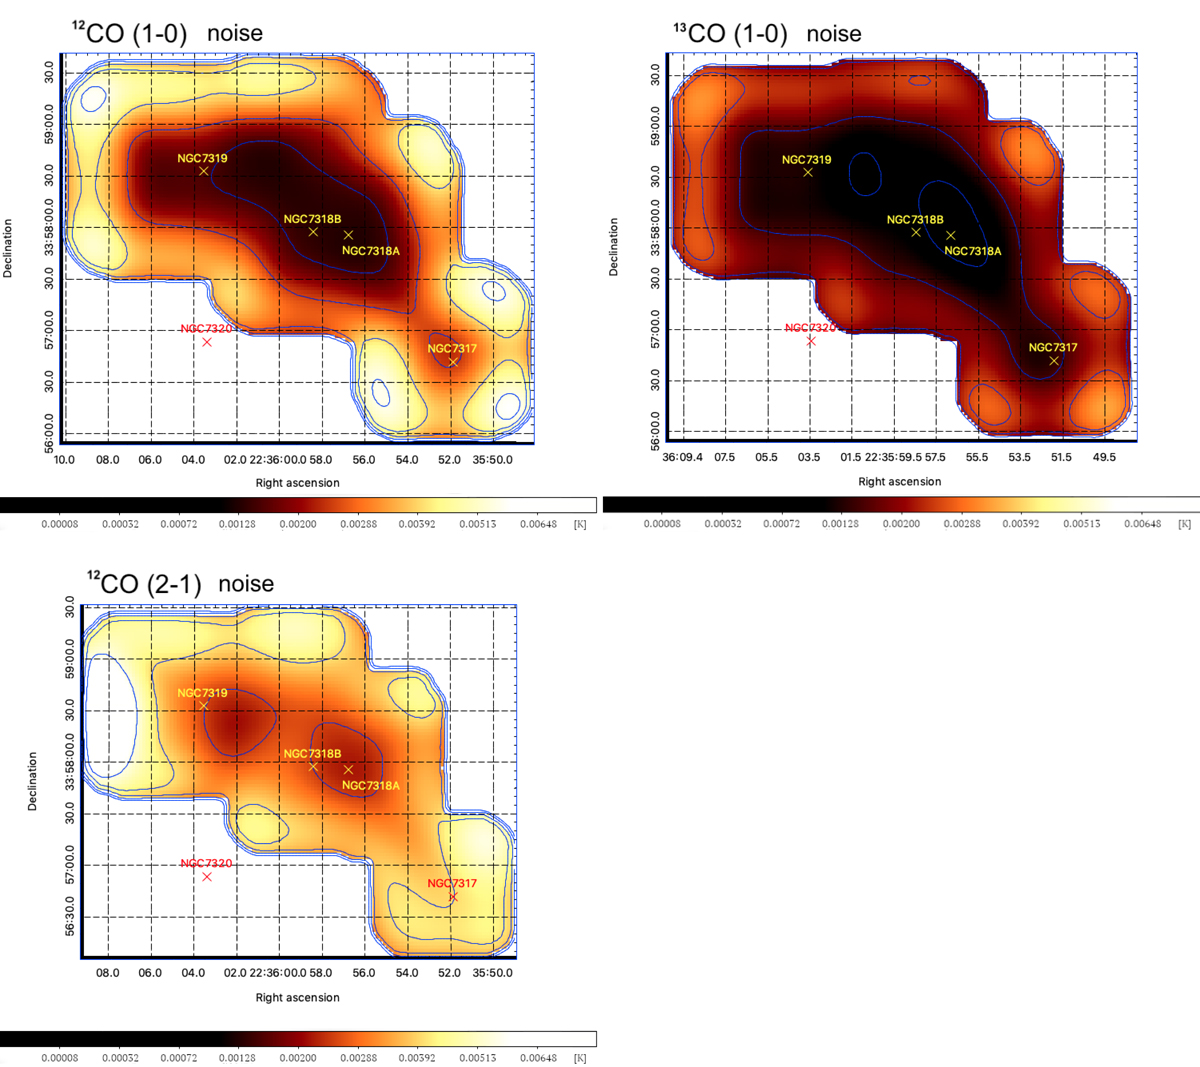
Fig. E.2.
Download original image
Maps showing the rms noise in the CO channels. The red and yellow crosses pinpoint the galaxies. Top Left: 12CO(1−0); Contours at 1.5, 2.5, 4.0 and 5.5 mK are displayed in blue. Bottom Left: 12CO(2−1). Contours at 2.5, 4.0, and 5.5 mK are displayed in blue. Top Right: 13CO(1−0). Contours at 0.9, 1.5, and 2.5 mK are displayed in blue.
Current usage metrics show cumulative count of Article Views (full-text article views including HTML views, PDF and ePub downloads, according to the available data) and Abstracts Views on Vision4Press platform.
Data correspond to usage on the plateform after 2015. The current usage metrics is available 48-96 hours after online publication and is updated daily on week days.
Initial download of the metrics may take a while.