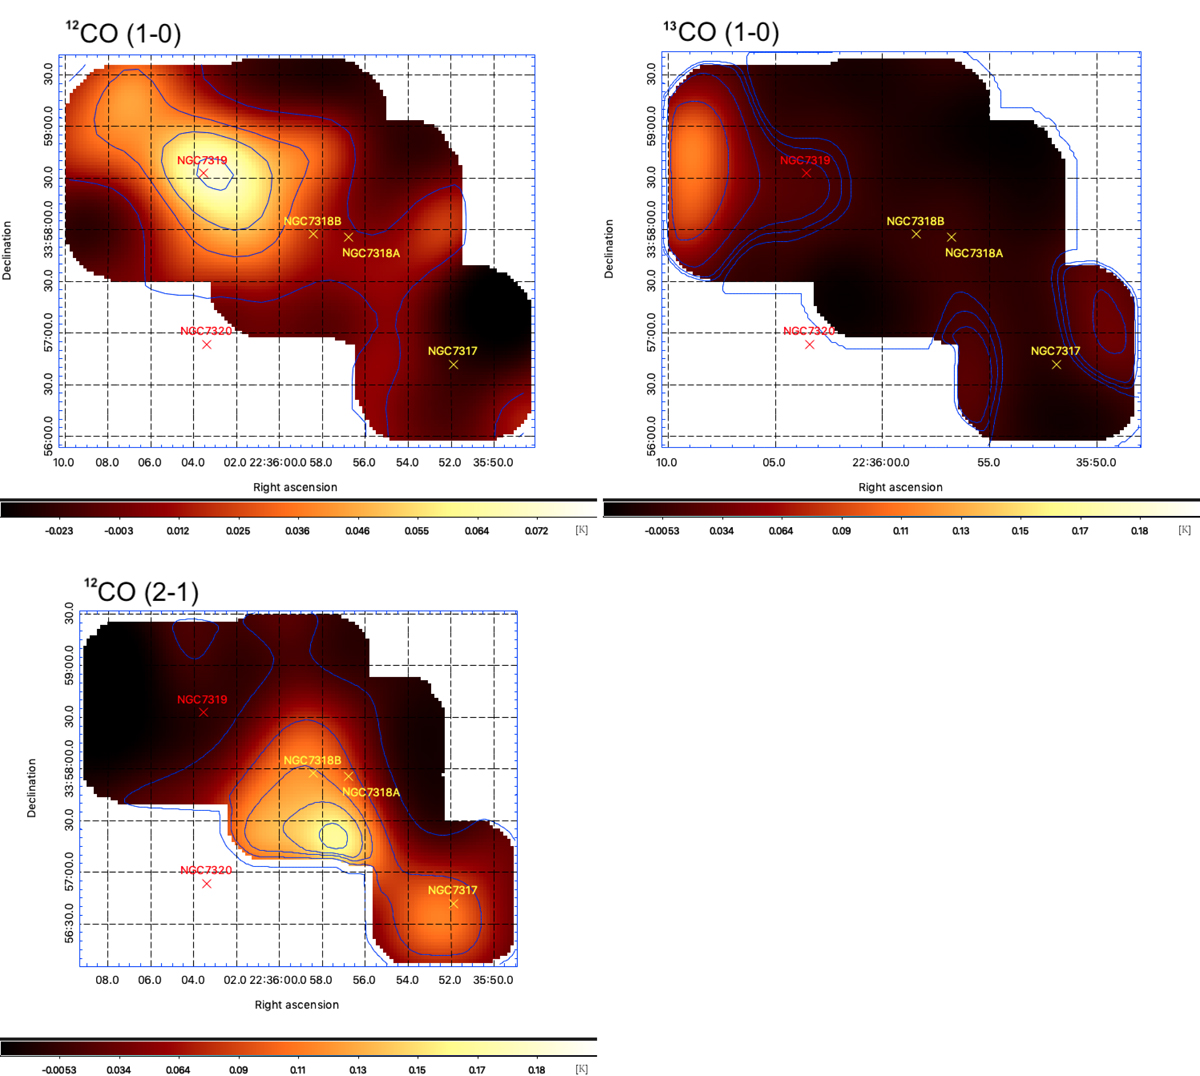
Fig. E.1.
Download original image
Maps showing the summed emission per spaxel of the CO channels over the velocity range 5100 − 7500 km/s. Contours in blue show the flux variations, while the red and yellow crosses pinpoint the galaxies. Top Left: 12CO(1−0) contours at 4, 35, 50, and 70 mK;. Bottom Left: 12CO(2−1), 4, 80, 120, 140, and 160 mK. Top Right: 13CO(1−0) contours at 0, 5, 10, 30, and 70 mK.
Current usage metrics show cumulative count of Article Views (full-text article views including HTML views, PDF and ePub downloads, according to the available data) and Abstracts Views on Vision4Press platform.
Data correspond to usage on the plateform after 2015. The current usage metrics is available 48-96 hours after online publication and is updated daily on week days.
Initial download of the metrics may take a while.