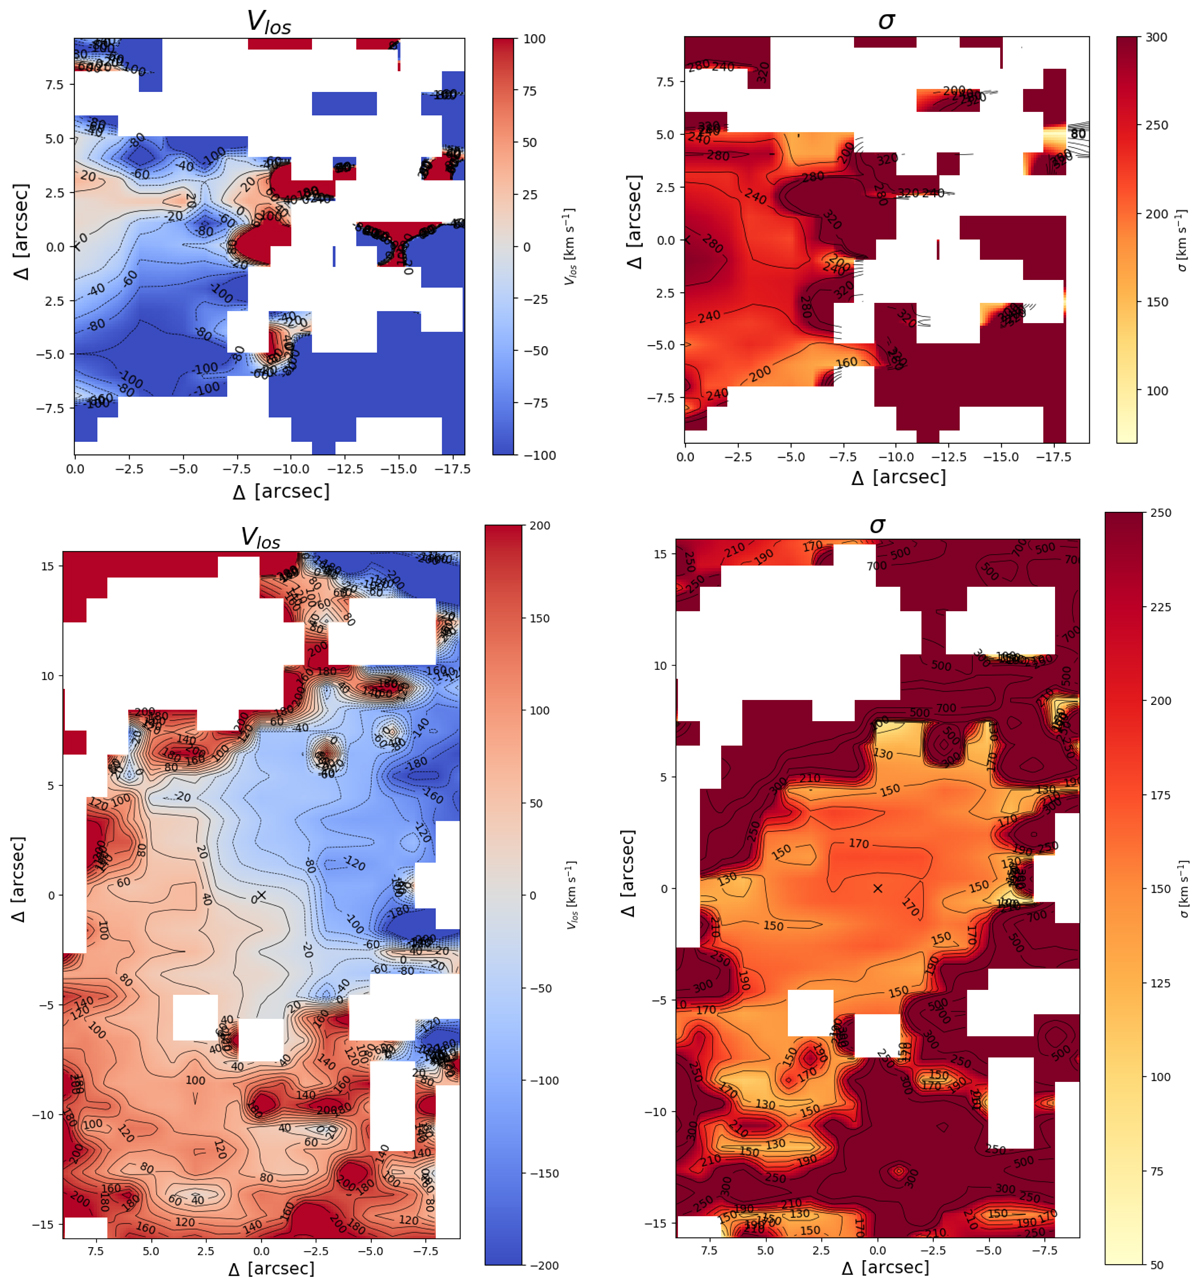
Fig. B.1.
Download original image
Top left: Map of the line-of-sight velocity in NGC7318A as a function of position. The 0 velocity is set to the average of the central 1.5″, 6787 ± 5 km/s, while the cross at 0 RA, 0 Dec. is the centre of the galaxy as seen by the peak stellar continuum emission. textitBottom left: Map of the line-of-sight velocity in NGC7318B as a function of position. Again, the 0 velocity is set to the average of the central 1.5″, 5973 ± 4 km/s, and the cross in the centre of the galaxy marks the peak stellar continuum emission. Top right: Map of the stellar velocity dispersion in NGC7318A as a function of position. As in the left image, the cross in the centre of the galaxy pinpoints the peak stellar continuum emission. Bottom right: Map of the stellar velocity dispersion in NGC7318B as a function of position. The cross in the centre of the galaxy again marks the peak stellar continuum emission.
Current usage metrics show cumulative count of Article Views (full-text article views including HTML views, PDF and ePub downloads, according to the available data) and Abstracts Views on Vision4Press platform.
Data correspond to usage on the plateform after 2015. The current usage metrics is available 48-96 hours after online publication and is updated daily on week days.
Initial download of the metrics may take a while.