Open Access
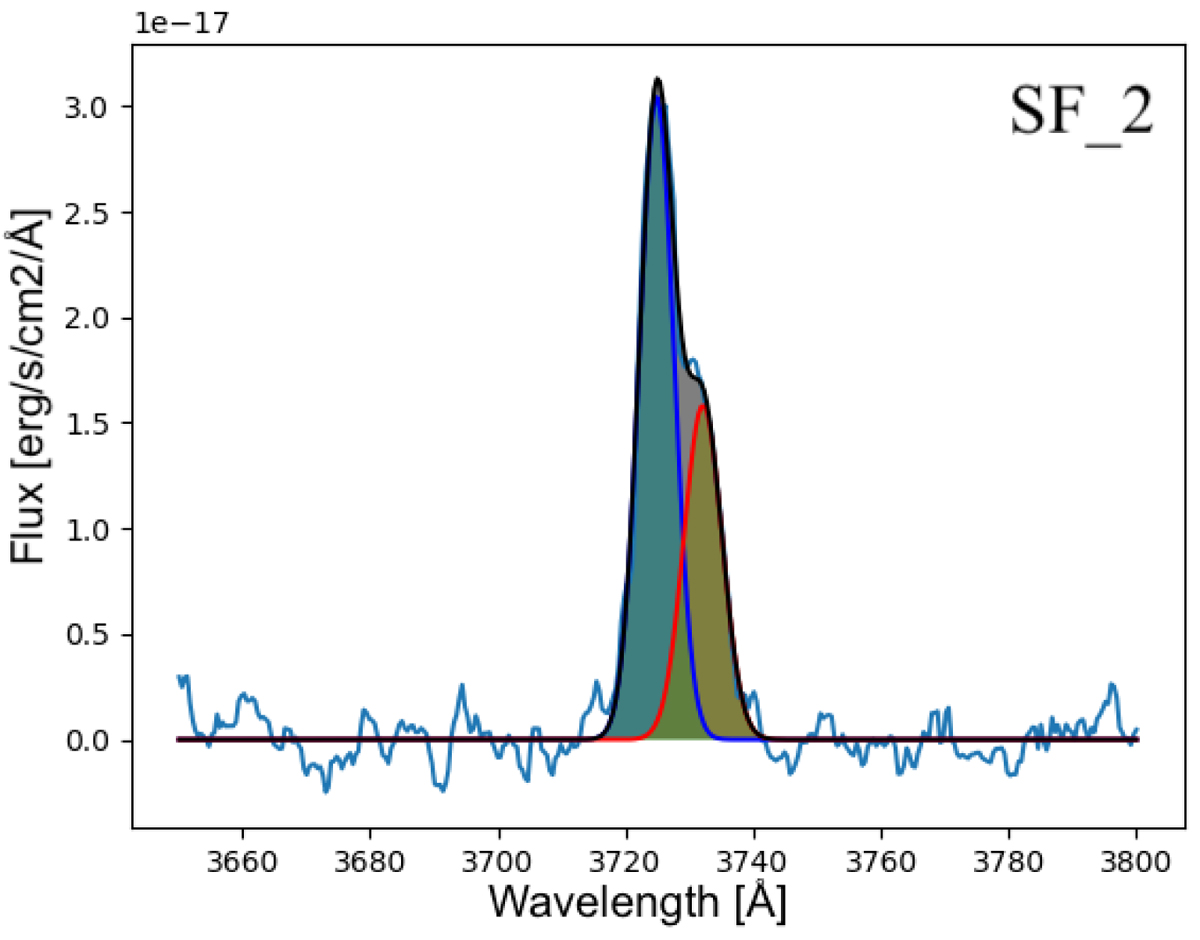
Fig. 20.
Download original image
Illustrating the dual velocity components in the [OII]λ3727 line in the SF ridge, region SF_2. The black line is the best fit, and the two different colours denote the different velocity components. The two velocity components are separated by 583 ± 21 km s−1 (table in Appendix G.2).
Current usage metrics show cumulative count of Article Views (full-text article views including HTML views, PDF and ePub downloads, according to the available data) and Abstracts Views on Vision4Press platform.
Data correspond to usage on the plateform after 2015. The current usage metrics is available 48-96 hours after online publication and is updated daily on week days.
Initial download of the metrics may take a while.