Open Access
Fig. 14.
Download original image
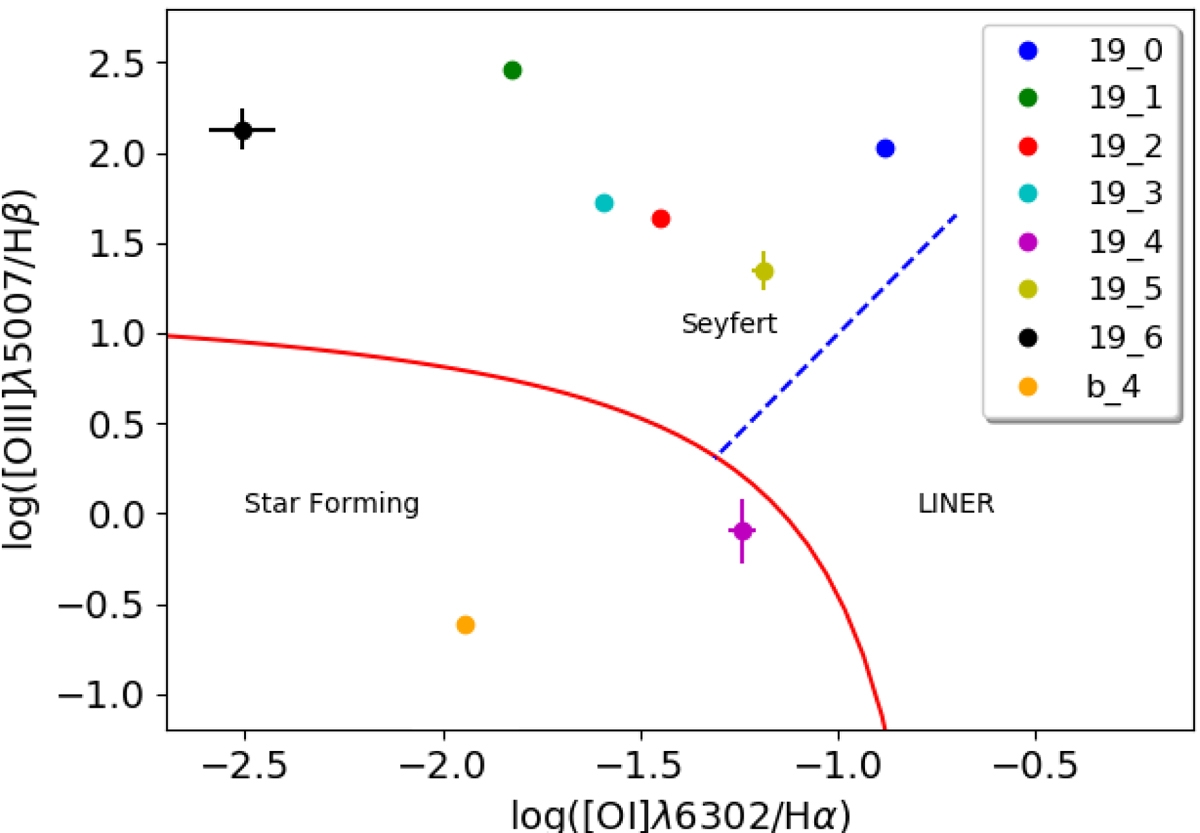
Optical diagnostic diagram, log([OI]λ6302/Hα) vs. log([OIII]λ5008/Hβ), for the regions in or near NGC7319, region 19_0-6, and the region in the bridge with sufficient emission, b_4.
Current usage metrics show cumulative count of Article Views (full-text article views including HTML views, PDF and ePub downloads, according to the available data) and Abstracts Views on Vision4Press platform.
Data correspond to usage on the plateform after 2015. The current usage metrics is available 48-96 hours after online publication and is updated daily on week days.
Initial download of the metrics may take a while.