Fig. 9.
Download original image
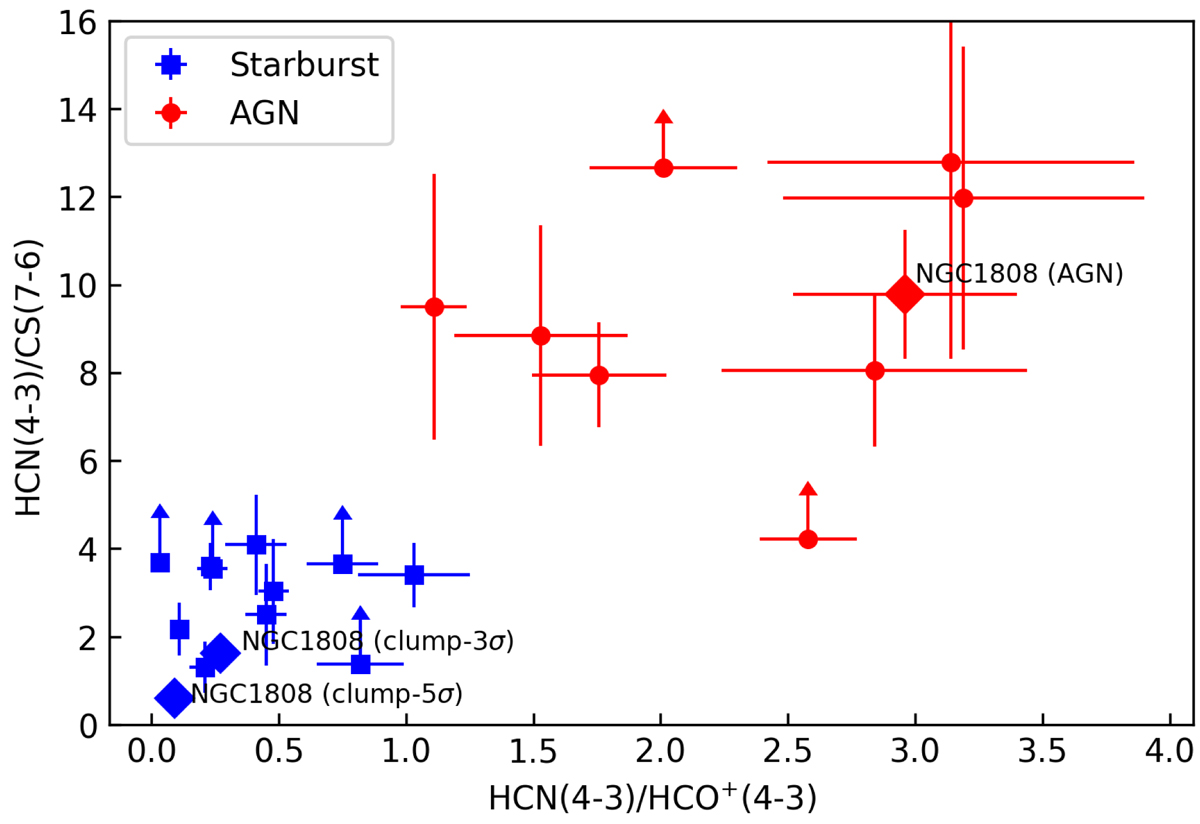
Submillimeter-HCN diagram proposed by Izumi et al. (2016) for the high-resolution observations (spatial resolution < 500 pc) using the line intensity ratios RHCN/HCO+ and RHCN/CS. Red circles represent the AGNs and the blue squares indicate the SB galaxies. We include the line ratios of NGC 1808 (diamonds) measured in the central spiral, called here as “AGN” and in a clump detected ∼150 pc north-west of central position in all the dense tracers.
Current usage metrics show cumulative count of Article Views (full-text article views including HTML views, PDF and ePub downloads, according to the available data) and Abstracts Views on Vision4Press platform.
Data correspond to usage on the plateform after 2015. The current usage metrics is available 48-96 hours after online publication and is updated daily on week days.
Initial download of the metrics may take a while.