Fig. 8.
Download original image
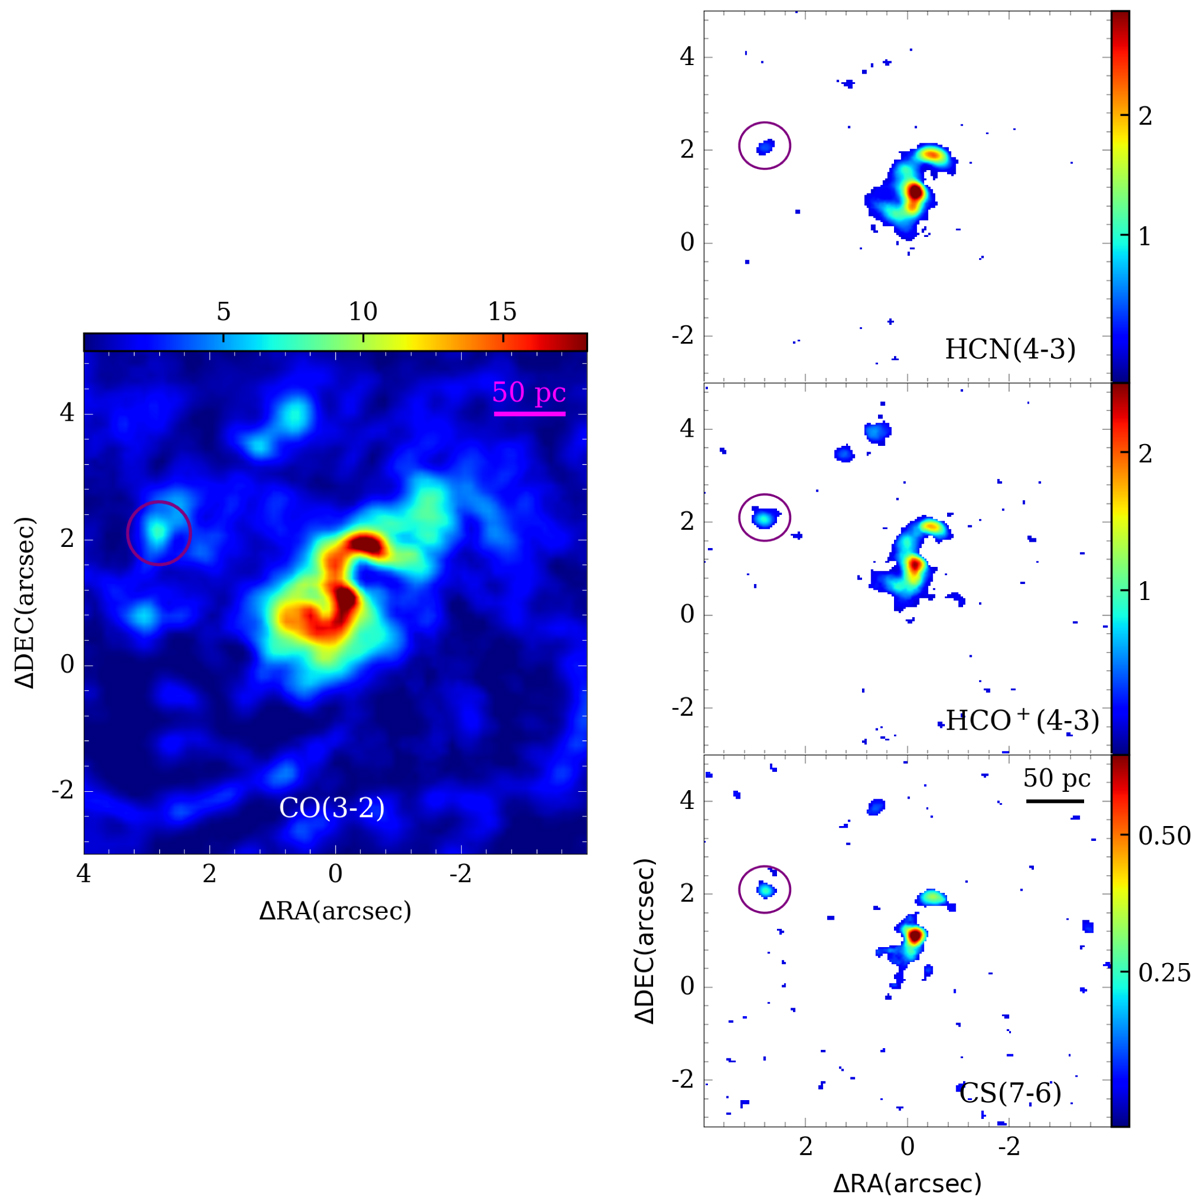
The nuclear spiral structure detected in CO(3−2), HCN(4−3), HCO+ and CS(7−6) emission. Left: zoomed 8″ × 8″ region of CO(3−2) intensity map for NGC 1808 of Fig. 3. Right: integrated intensity maps of the dense gas tracers HCN(4−3), HCO+(4−3) and CS(7−6) in the top, middle and bottom panels, respectively, in the same region. The purple circle indicates the position of a clump detected in the HCN, HCO+ and CS.
Current usage metrics show cumulative count of Article Views (full-text article views including HTML views, PDF and ePub downloads, according to the available data) and Abstracts Views on Vision4Press platform.
Data correspond to usage on the plateform after 2015. The current usage metrics is available 48-96 hours after online publication and is updated daily on week days.
Initial download of the metrics may take a while.