Fig. 5.
Download original image
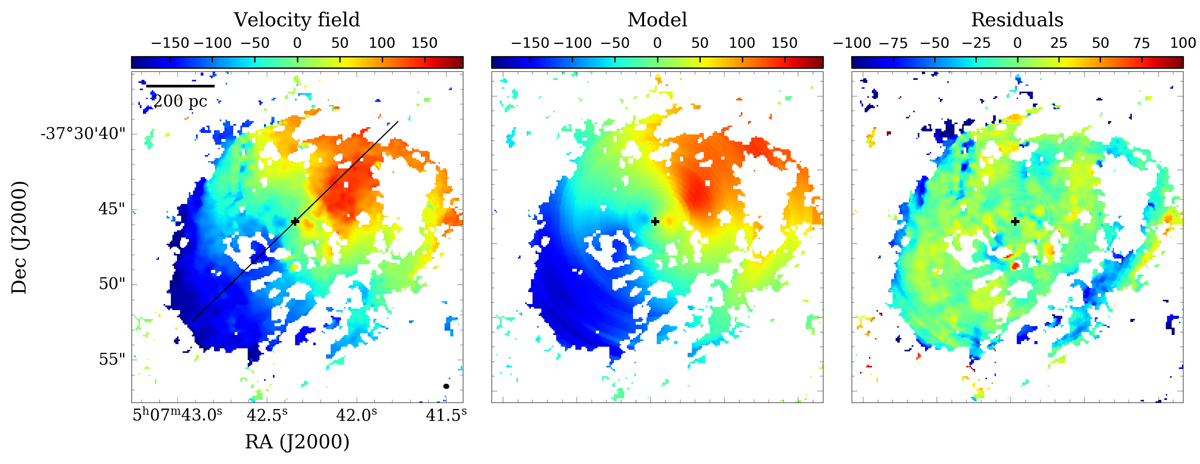
Model of the velocity field using the tilted rings approach. Left: velocity map of NGC 1808 clipped at > 3σ. Middle panel: best fit using the tilted-ring model Rogstad et al. (1974) and the residuals, after subtracting the model from the data, are shown on the right. The straight line in the left panel represents the kinematical PA = 314° of the major axis derived from the best fit and the black cross indicates the center of the nuclear spiral adopted as the center position in the rotation curve fitting.
Current usage metrics show cumulative count of Article Views (full-text article views including HTML views, PDF and ePub downloads, according to the available data) and Abstracts Views on Vision4Press platform.
Data correspond to usage on the plateform after 2015. The current usage metrics is available 48-96 hours after online publication and is updated daily on week days.
Initial download of the metrics may take a while.