Fig. 3.
Download original image
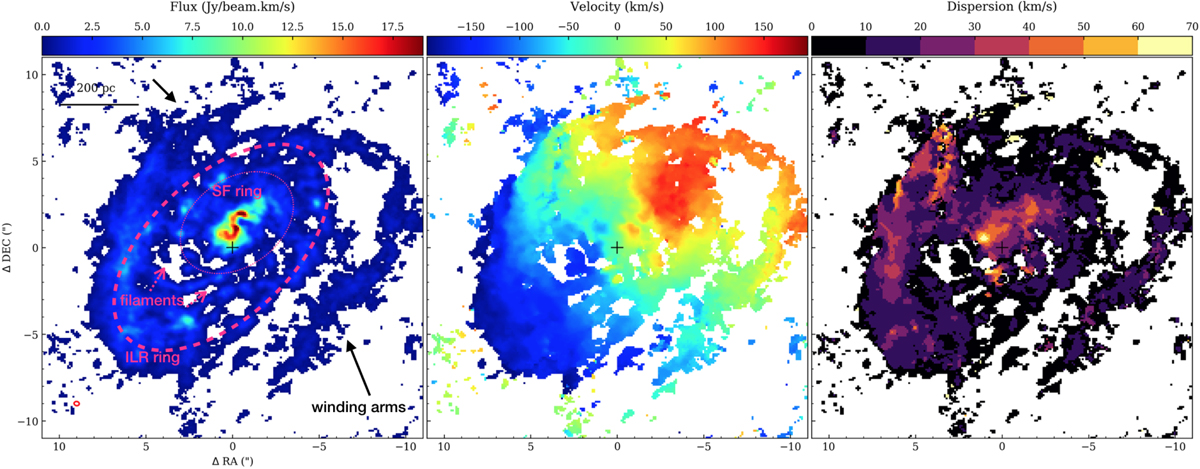
CO(3−2) moments maps of NGC 1808 in the central 22″ (∼1 kpc). Left: integrated intensity map (0th moment) of CO(3−2). Middle: mean velocity (1st moment). Right: velocity dispersion (2nd moment). The synthesized beam is indicated as the red ellipse in the bottom left corner of the integrated intensity map. The main morphological features of the CO(3−2) emission are indicated in the 0th moment map: the ILR ring (dashed pink ellipse) projected to the galaxy inclination, i = 57°; the SF ring (dotted pink ellipse) projected to the same i = 52° of the ionized and H2 gas detected with SINFONI by Busch et al. (2017); the pink arrows indicate the position of the filamentary structure connecting the rings; and the black arrows show the outer winding spiral arms. The black cross corresponds to the phase center of our observations, listed in Table 1.
Current usage metrics show cumulative count of Article Views (full-text article views including HTML views, PDF and ePub downloads, according to the available data) and Abstracts Views on Vision4Press platform.
Data correspond to usage on the plateform after 2015. The current usage metrics is available 48-96 hours after online publication and is updated daily on week days.
Initial download of the metrics may take a while.