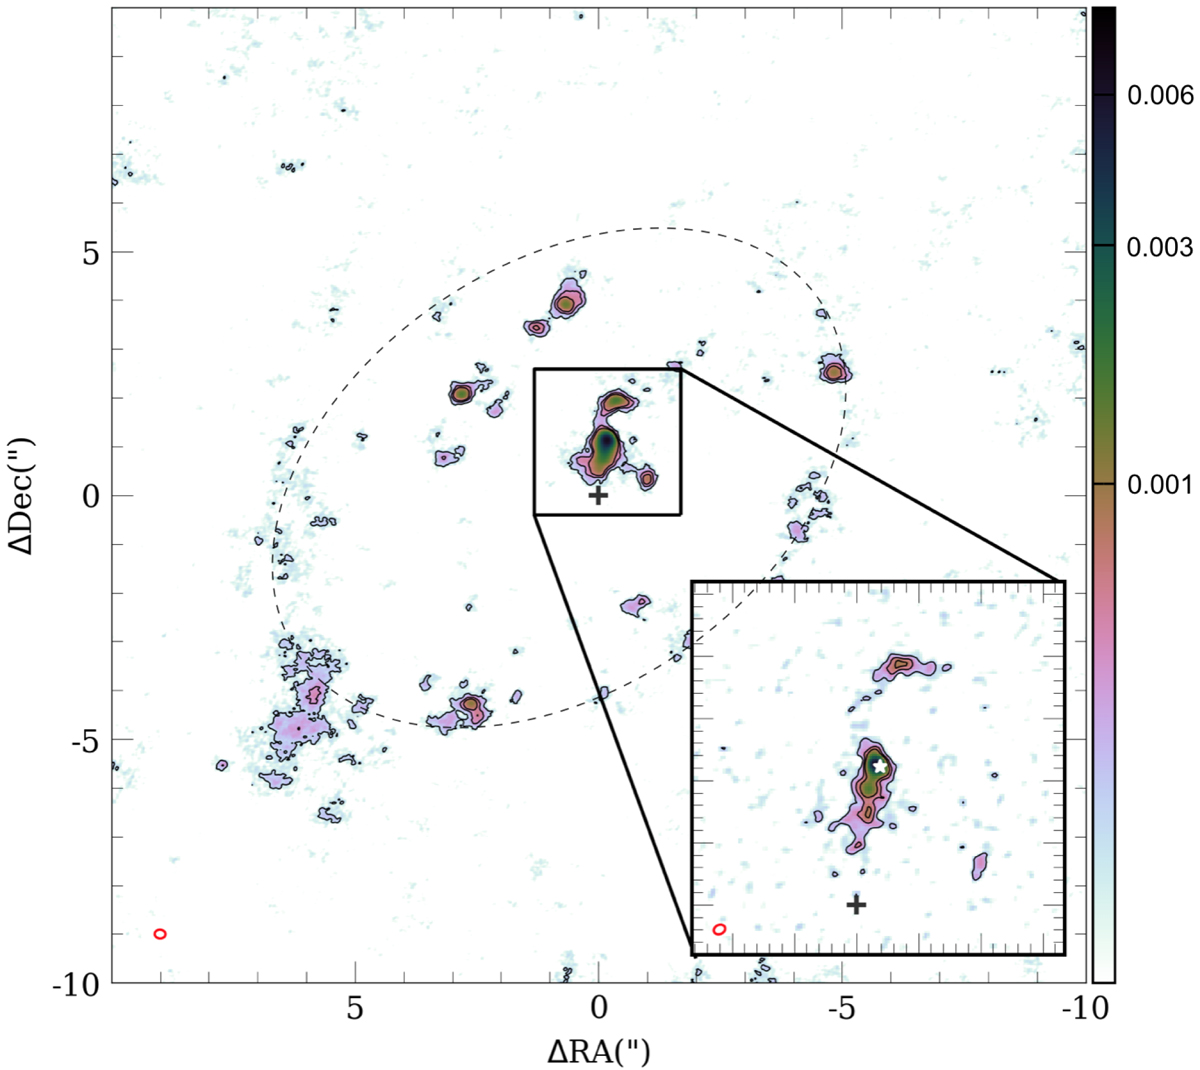
Fig. 2.
Download original image
Continuum emission at 0.87 mm. The central 20″ × 20″ is shown in the main panel for the natural weighting image (contA). The red ellipse at the bottom left corner indicates the synthesized beam size of 0.22″ × 0.18″ at PA = 86°. The contours are 3, 5, and 9 times the σrms. The zoom-in of the central 3″ × 3″ at high resolution (0.09″ × 0.07″ at PA = 115°, contB) is shown in the bottom-right corner. The black cross indicates the adopted phase center, while the white star represents the peak of the continuum emission, assumed to be the AGN position (see Table 1). The color scale is in Jy beam−1.
Current usage metrics show cumulative count of Article Views (full-text article views including HTML views, PDF and ePub downloads, according to the available data) and Abstracts Views on Vision4Press platform.
Data correspond to usage on the plateform after 2015. The current usage metrics is available 48-96 hours after online publication and is updated daily on week days.
Initial download of the metrics may take a while.