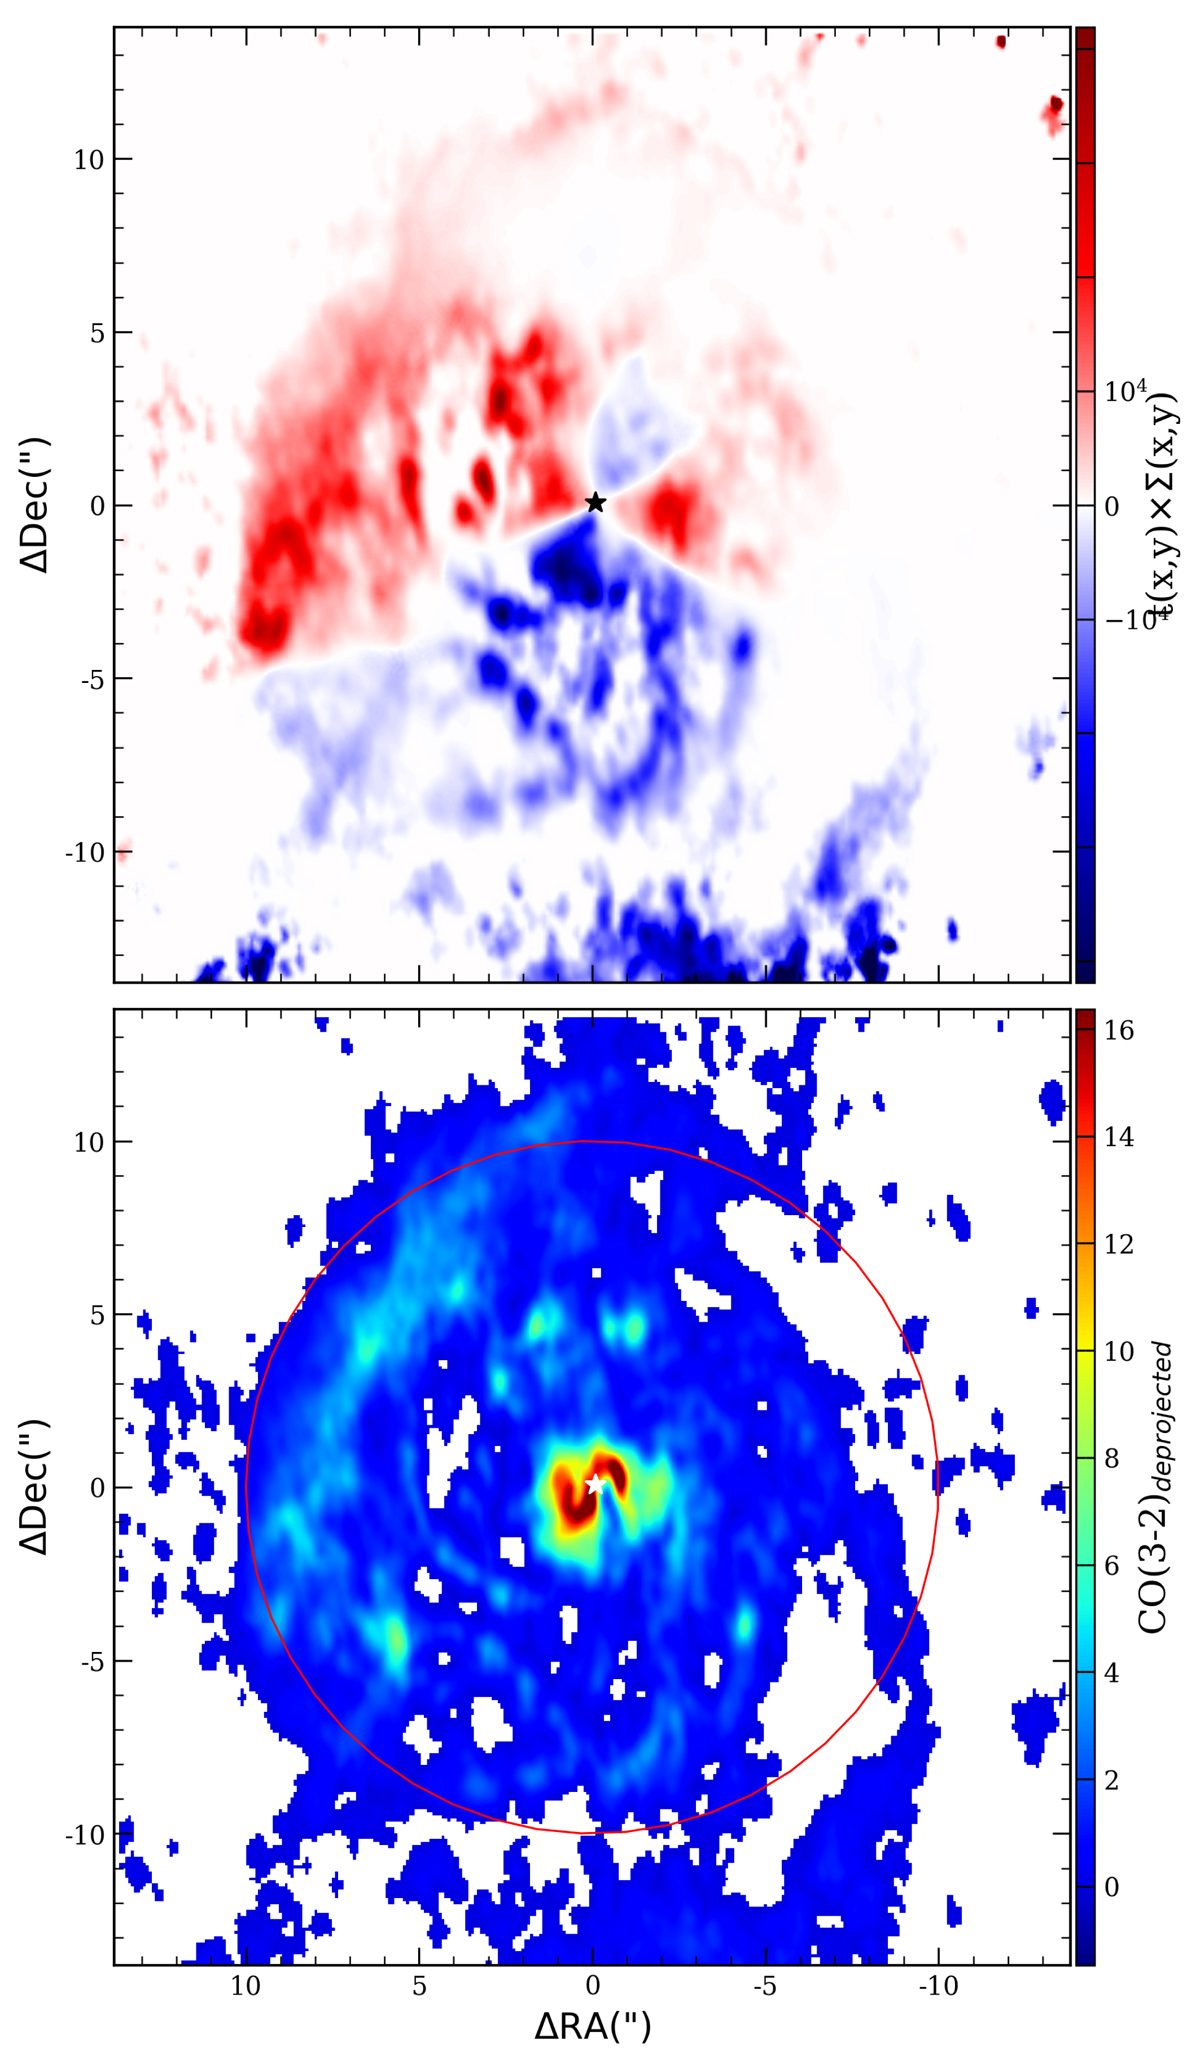
Fig. 16.
Download original image
De-projected maps of the gravitational torque and the CO(3−2) emission. Top: map of the gravitational torque, t(x, y)×Σ(x, y), in the center of NGC 1808. The torques change sign as expected in a four-quadrant pattern (or butterfly diagram). The orientation of the quadrants follows the nuclear bar’s orientation. In this de-projected picture, the major axis of the galaxy is oriented parallel to the horizontal axis. Bottom: de-projected image of the CO(3−2) emission, at the same scale and with the same orientation, for comparison. The ILR is indicated as a red circle.
Current usage metrics show cumulative count of Article Views (full-text article views including HTML views, PDF and ePub downloads, according to the available data) and Abstracts Views on Vision4Press platform.
Data correspond to usage on the plateform after 2015. The current usage metrics is available 48-96 hours after online publication and is updated daily on week days.
Initial download of the metrics may take a while.