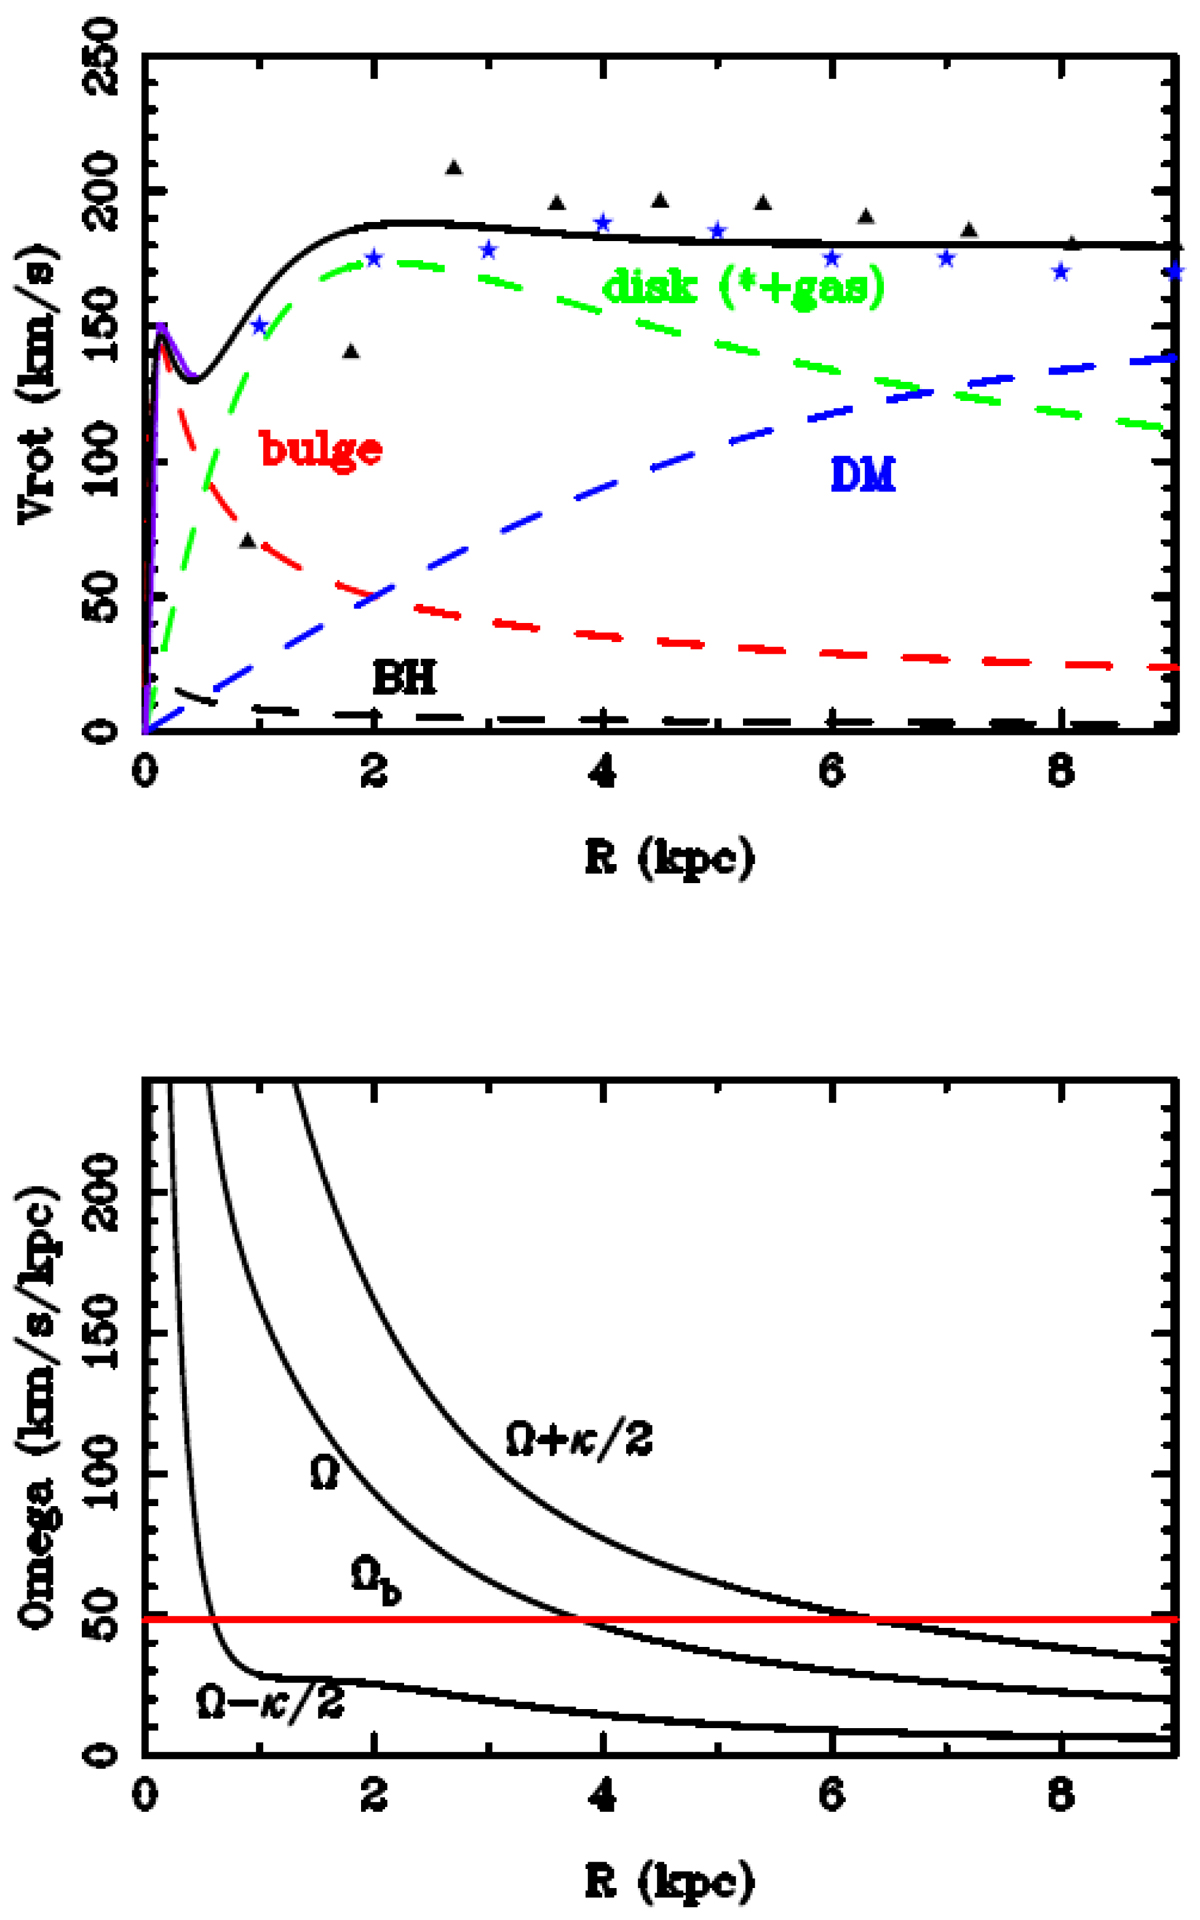
Fig. 14.
Download original image
Rotation curve model for NGC 1808. Top: an analytical model is built with five mass components: the stellar bulge and disk, the dark matter halo, the black hole, and the gaseous disk. The latter is included in the stellar disk. The contribution of each component is indicated as a dashed line. The blue symbols (stars) are adapted from the observations of Hα by Saikia et al. (1990) (average of the NW and SE sides) and the black triangles from the HI observations (Koribalski et al. 1993). Our CO rotation curve, corrected for bar perturbation, is indicated by the purple line. Bottom: derived frequencies Ω, Ω ± κ/2, indicating the Lindblad resonances, with the pattern speed of the bar highlighted in red.
Current usage metrics show cumulative count of Article Views (full-text article views including HTML views, PDF and ePub downloads, according to the available data) and Abstracts Views on Vision4Press platform.
Data correspond to usage on the plateform after 2015. The current usage metrics is available 48-96 hours after online publication and is updated daily on week days.
Initial download of the metrics may take a while.