Open Access
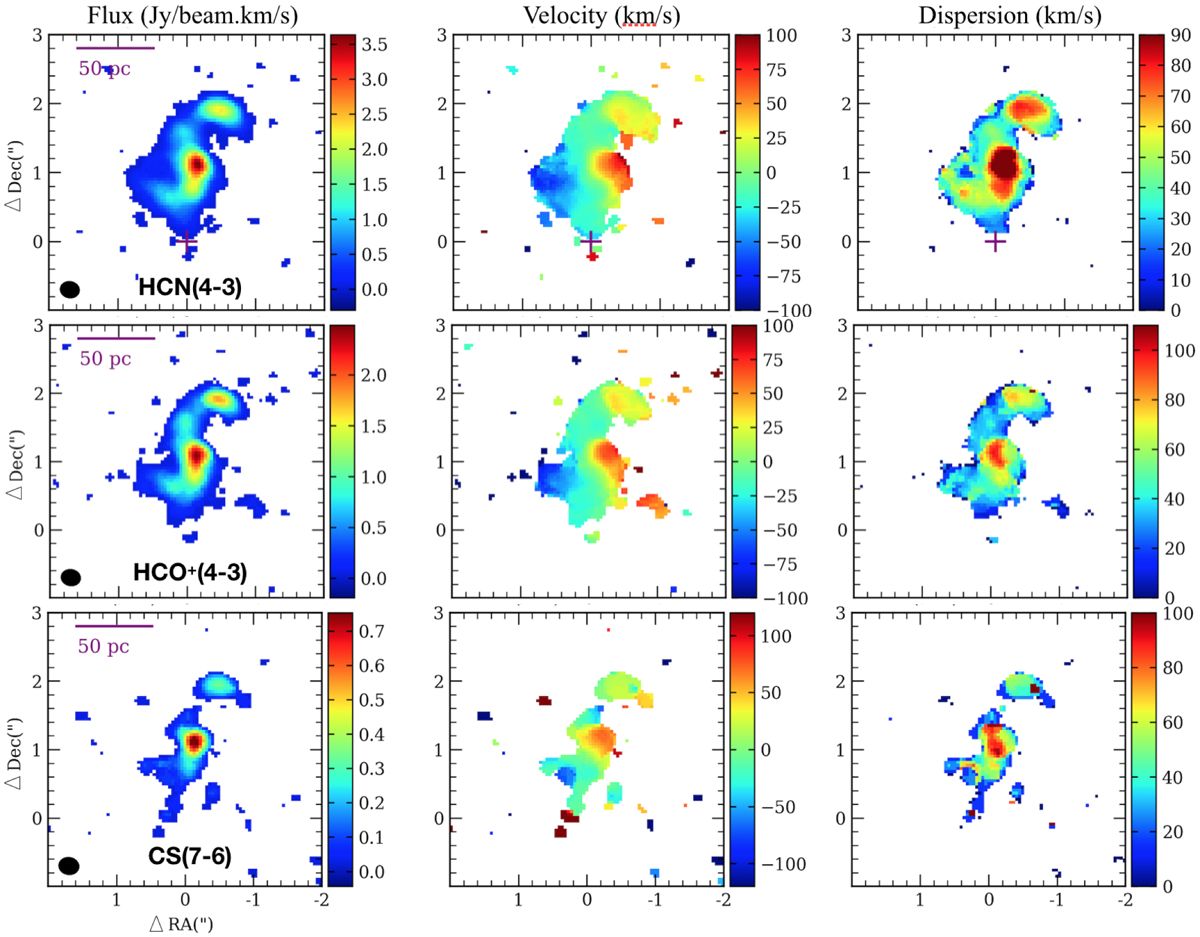
Fig. 13.
Download original image
The moment maps of the central emission of HCN(4−3), HCO+(4−3) and CS(7−6) (from top to bottom). The synthesized beam sizes are show in the bottom left corner of the zero-moment map of each line. The purple cross is the phase of the observations.
Current usage metrics show cumulative count of Article Views (full-text article views including HTML views, PDF and ePub downloads, according to the available data) and Abstracts Views on Vision4Press platform.
Data correspond to usage on the plateform after 2015. The current usage metrics is available 48-96 hours after online publication and is updated daily on week days.
Initial download of the metrics may take a while.