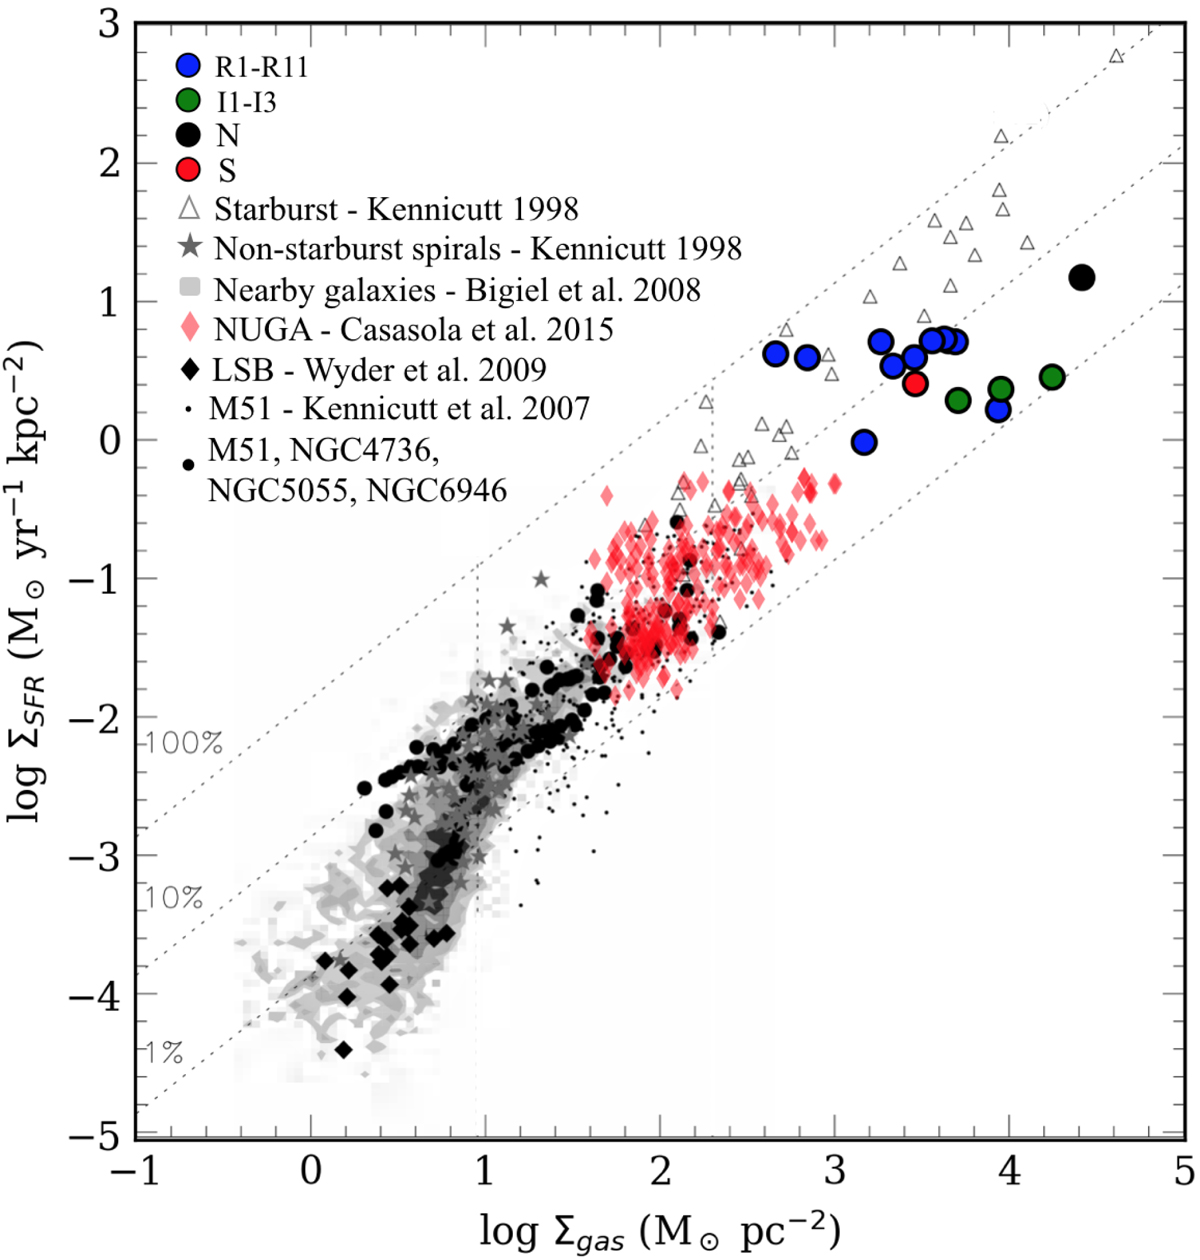
Fig. 11.
Download original image
Relation between the SFR determined from Paα and gas surface densities, in the 16 regions delimited in Fig. 10. The nuclear region (N) is indicated by the big black circle, the region along the circumnuclear ring (R1–R11) in blue, the south region (S) in red, and in intermediate (I1–I3) regions in green. The NGC 1808 data points are compared to the KS relation from different surveys: the resolved KS law in nearby galaxies by Bigiel et al. (2008) in gray; the NUGA sample by Casasola et al. (2015), shown as red diamonds; global measurements of Starburst galaxies (open triangles) and non-Starburst spirals (gray stars) by Kennicutt (1998, 2007) measurements in individual apertures of M 51 (black dots); and radial profiles in the nearby spiral galaxies M 51 (Schuster et al. 2007), NGC 4736 and NGC 5055 (Wong & Blitz 2002) and NGC 6946 (Crosthwaite & Turner 2007), indicated as small black circles. Figure adapted from Bigiel et al. (2008).
Current usage metrics show cumulative count of Article Views (full-text article views including HTML views, PDF and ePub downloads, according to the available data) and Abstracts Views on Vision4Press platform.
Data correspond to usage on the plateform after 2015. The current usage metrics is available 48-96 hours after online publication and is updated daily on week days.
Initial download of the metrics may take a while.