Fig. 10.
Download original image
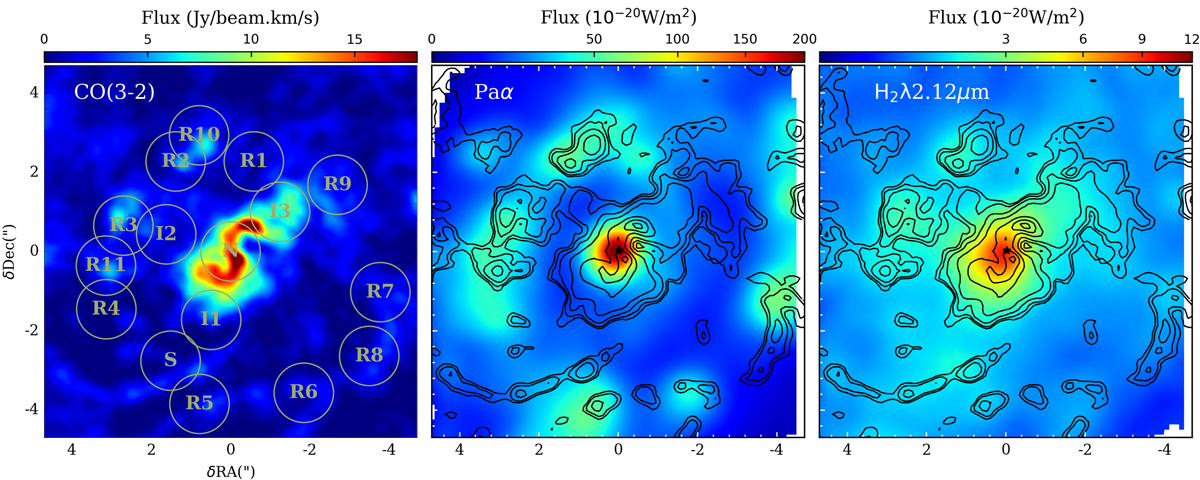
Comparison between the CO(3−2) emission in the central 9″ × 9″ (left panel), with the Paα (middle) and H2λ2.12 μm (right) emission in the 8″ × 8″ FoV of the SINFONI observations (Busch et al. 2017). The CO contours are overlaid in the NIR images. The black star represents the AGN position listed in Table 1. Left panel: 15 regions are identified, R1–R11, I1–I3 and N, to compute the Kennicutt–Schmidt relation of Fig. 11.
Current usage metrics show cumulative count of Article Views (full-text article views including HTML views, PDF and ePub downloads, according to the available data) and Abstracts Views on Vision4Press platform.
Data correspond to usage on the plateform after 2015. The current usage metrics is available 48-96 hours after online publication and is updated daily on week days.
Initial download of the metrics may take a while.