Free Access
Fig. 7
Download original image
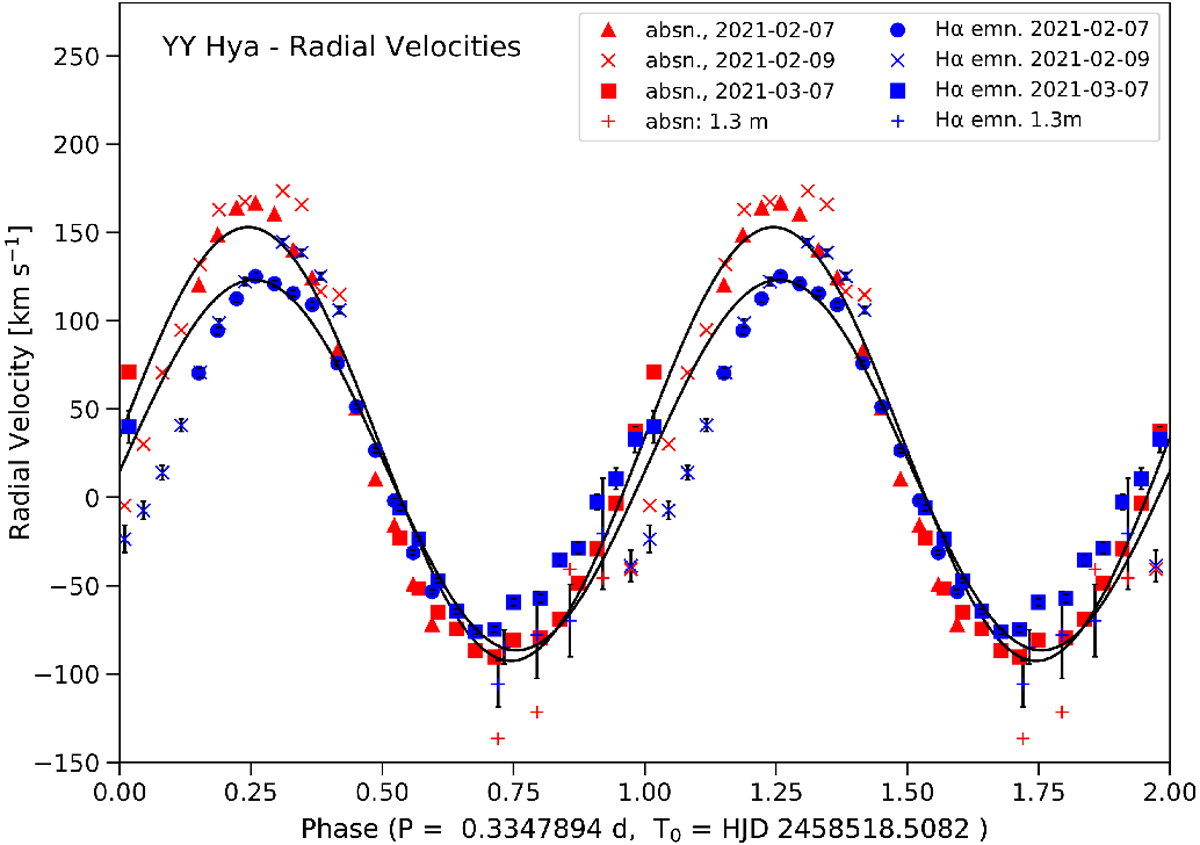
Radial velocities of the absorption component and Hα emission line in YY Hya as a function of the period and epoch derived from the photometry. To preserve continuity, the data are repeated for one cycle. Solid lines show the best-fitting sinusoids.
Current usage metrics show cumulative count of Article Views (full-text article views including HTML views, PDF and ePub downloads, according to the available data) and Abstracts Views on Vision4Press platform.
Data correspond to usage on the plateform after 2015. The current usage metrics is available 48-96 hours after online publication and is updated daily on week days.
Initial download of the metrics may take a while.