Fig. 6
Download original image
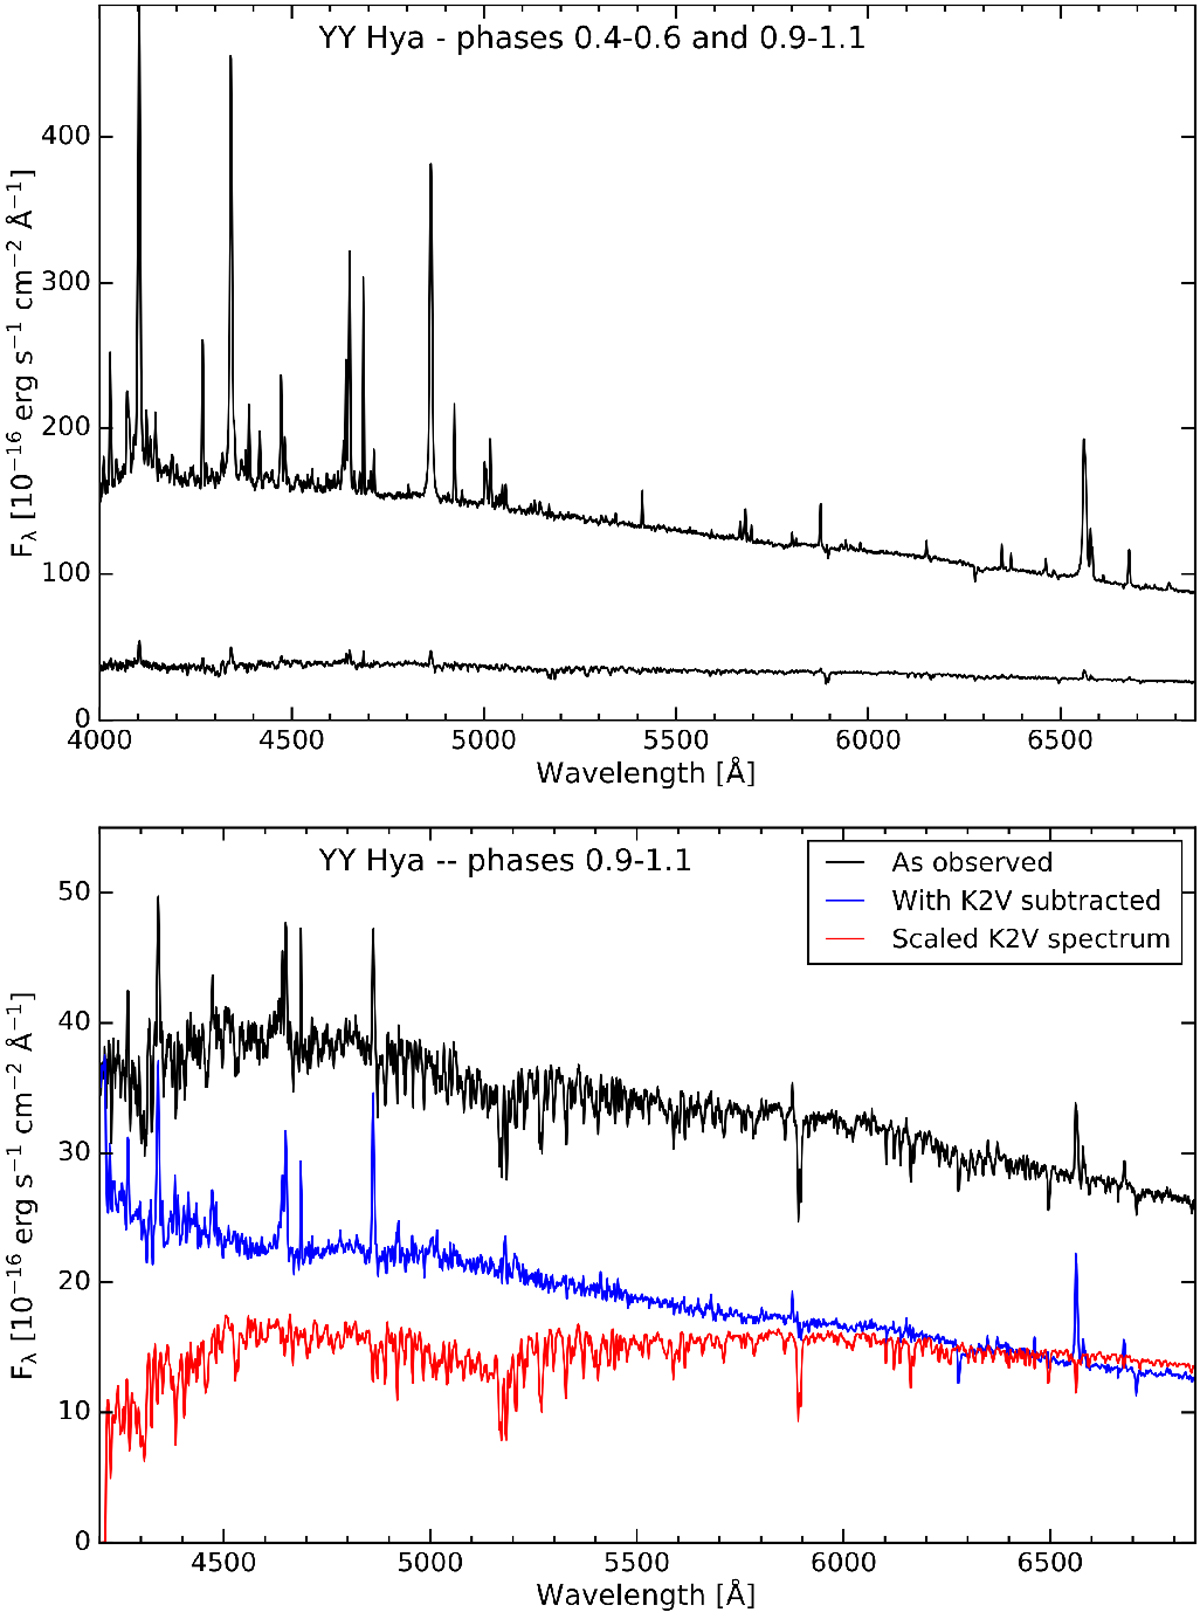
Overview about the spectroscopic behaviour at different phases of the light curve. Upper panel: mean OSMOS spectra from 2021 February and March. The top trace is the average of spectra taken near maximum light, and the bottom trace near minimum light. The vertical axis is the same for both traces. Lower panel: upper, black trace shows the same minimum-light spectrum as the top trace. The red trace is a scaled spectrum of a K2 V star, while the blue trace resultsfrom subtracting the scaled K-type spectrum from the observed spectrum.
Current usage metrics show cumulative count of Article Views (full-text article views including HTML views, PDF and ePub downloads, according to the available data) and Abstracts Views on Vision4Press platform.
Data correspond to usage on the plateform after 2015. The current usage metrics is available 48-96 hours after online publication and is updated daily on week days.
Initial download of the metrics may take a while.