Fig. 13
Download original image
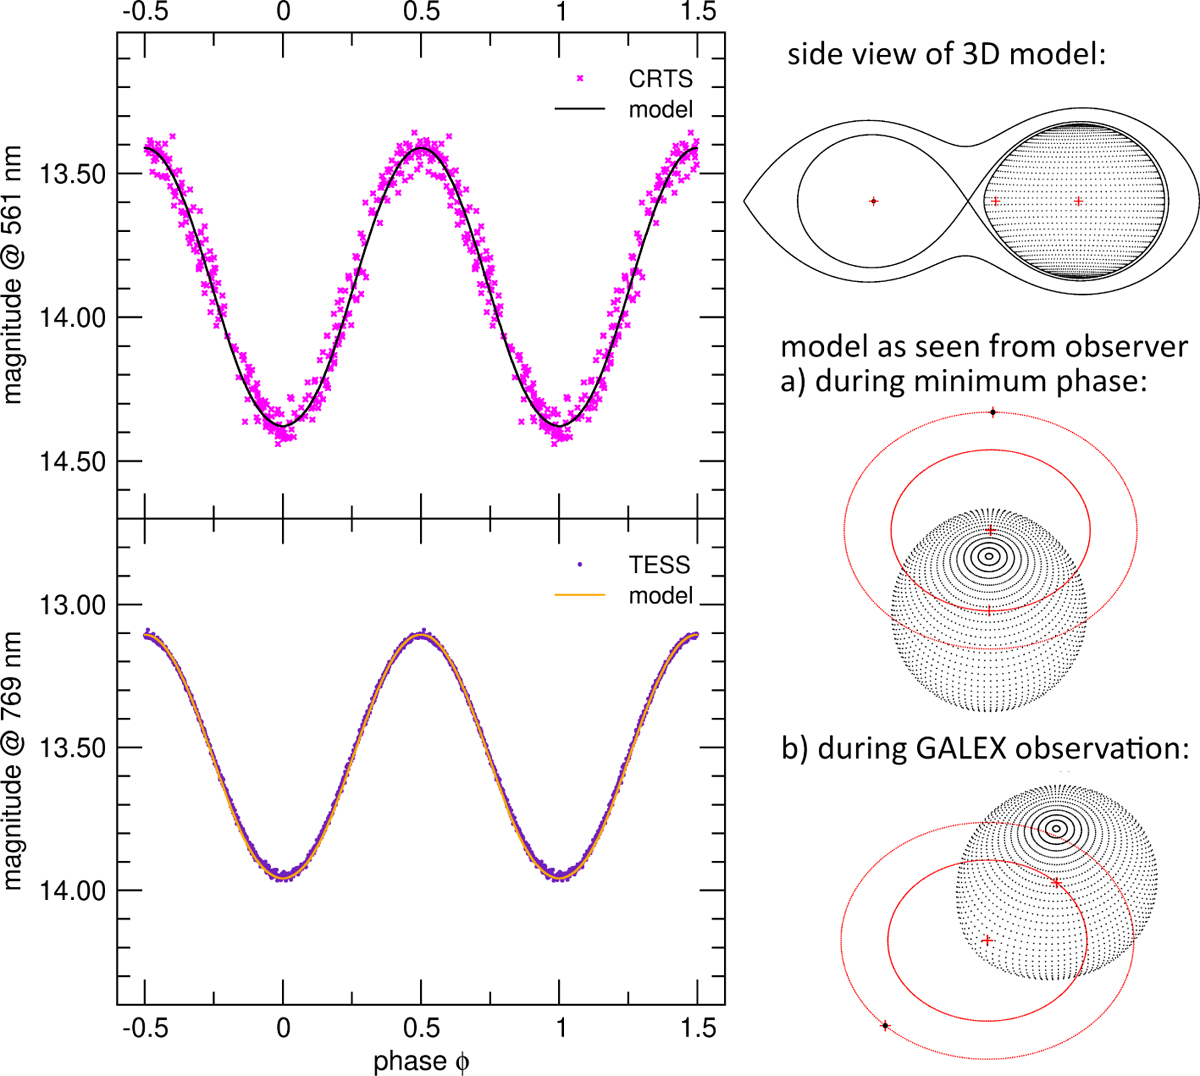
BM3 model – best fit model based on the red passband TESS data and then calculated for the shorter wavelength CRTS data to constrain the temperatures of the components by the higher amplitude in the visual wavelength. The drawings (from top to bottom) show the side view including the Roche lobe limit, the model at minimum phase showing mainly the cold side of the MS star, and the phase during the GALEX observations showing nearly the whole hot side. The crosses mark the mass centers of the stars and the system barycenter. Red ellipses are the projected orbits.
Current usage metrics show cumulative count of Article Views (full-text article views including HTML views, PDF and ePub downloads, according to the available data) and Abstracts Views on Vision4Press platform.
Data correspond to usage on the plateform after 2015. The current usage metrics is available 48-96 hours after online publication and is updated daily on week days.
Initial download of the metrics may take a while.