Fig. 10
Download original image
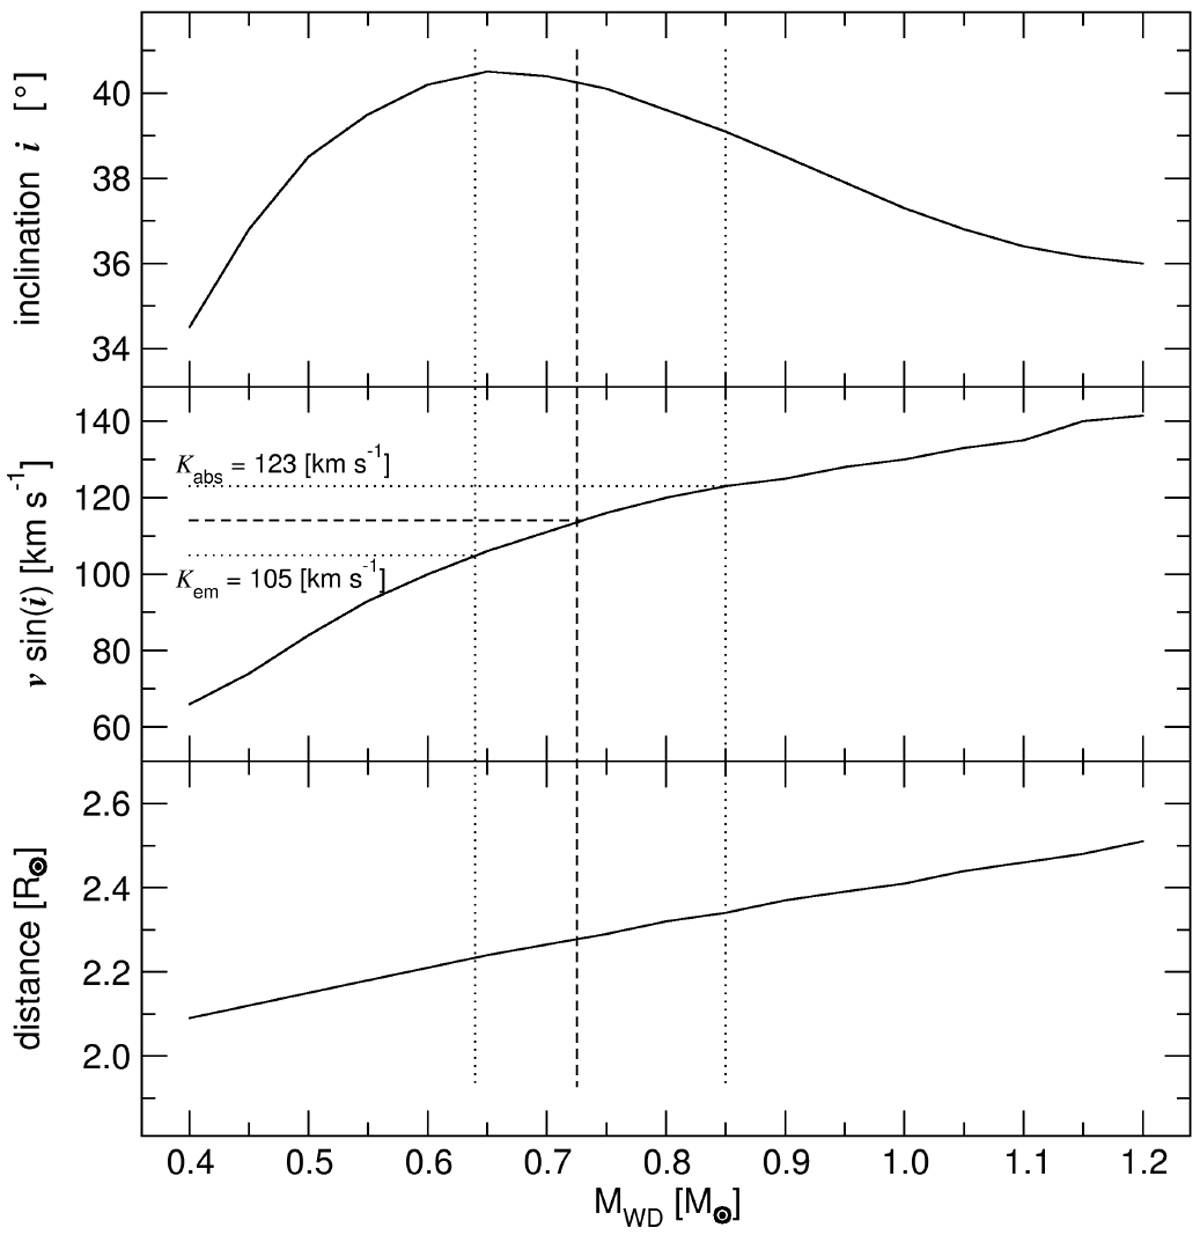
Resulting best-fit model as function of the mass of the white dwarf. The inclination, i, of the system (top), the resulting K half velocityamplitude (middle), and the orbital separation of the mass centers of the stars (bottom panel). The dashed line marks the average between the extreme cases of the emission and the absorption line velocities, while the dotted lines mark the two extreme cases (see text).
Current usage metrics show cumulative count of Article Views (full-text article views including HTML views, PDF and ePub downloads, according to the available data) and Abstracts Views on Vision4Press platform.
Data correspond to usage on the plateform after 2015. The current usage metrics is available 48-96 hours after online publication and is updated daily on week days.
Initial download of the metrics may take a while.