Fig. 4.
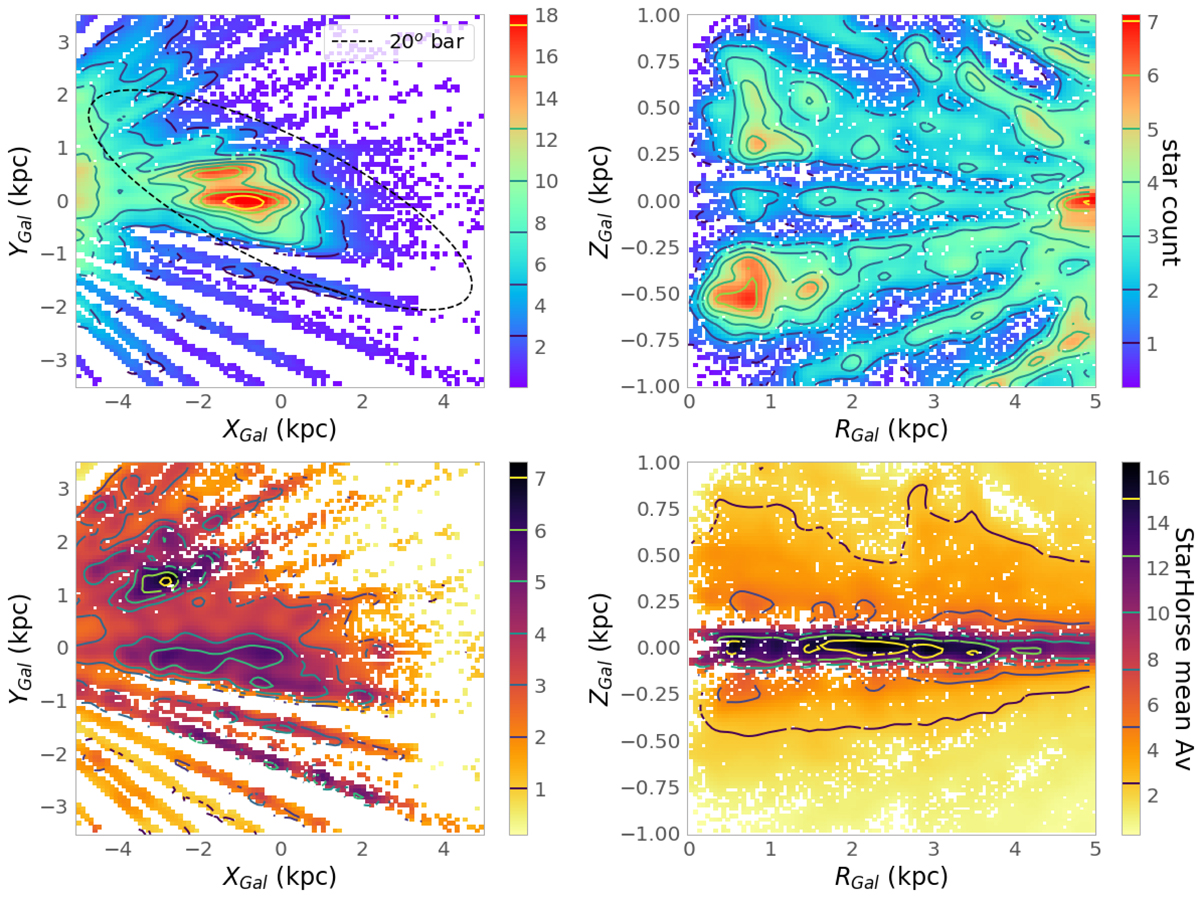
Download original image
Cartesian (left panels) and cylindrical (right panels) projections of the GC using the APOGEE survey and StarHorse distances. Upper panels: map colour-coded by the logarithmic number of stars and lower panels: colour-coded by StarHorse extinction. Contours are shown for the densest regions as indicated by the colour bar. An ellipse is drawn in the first panel to indicate the approximate location of the Galactic bar.
Current usage metrics show cumulative count of Article Views (full-text article views including HTML views, PDF and ePub downloads, according to the available data) and Abstracts Views on Vision4Press platform.
Data correspond to usage on the plateform after 2015. The current usage metrics is available 48-96 hours after online publication and is updated daily on week days.
Initial download of the metrics may take a while.