Fig. 25.
Download original image
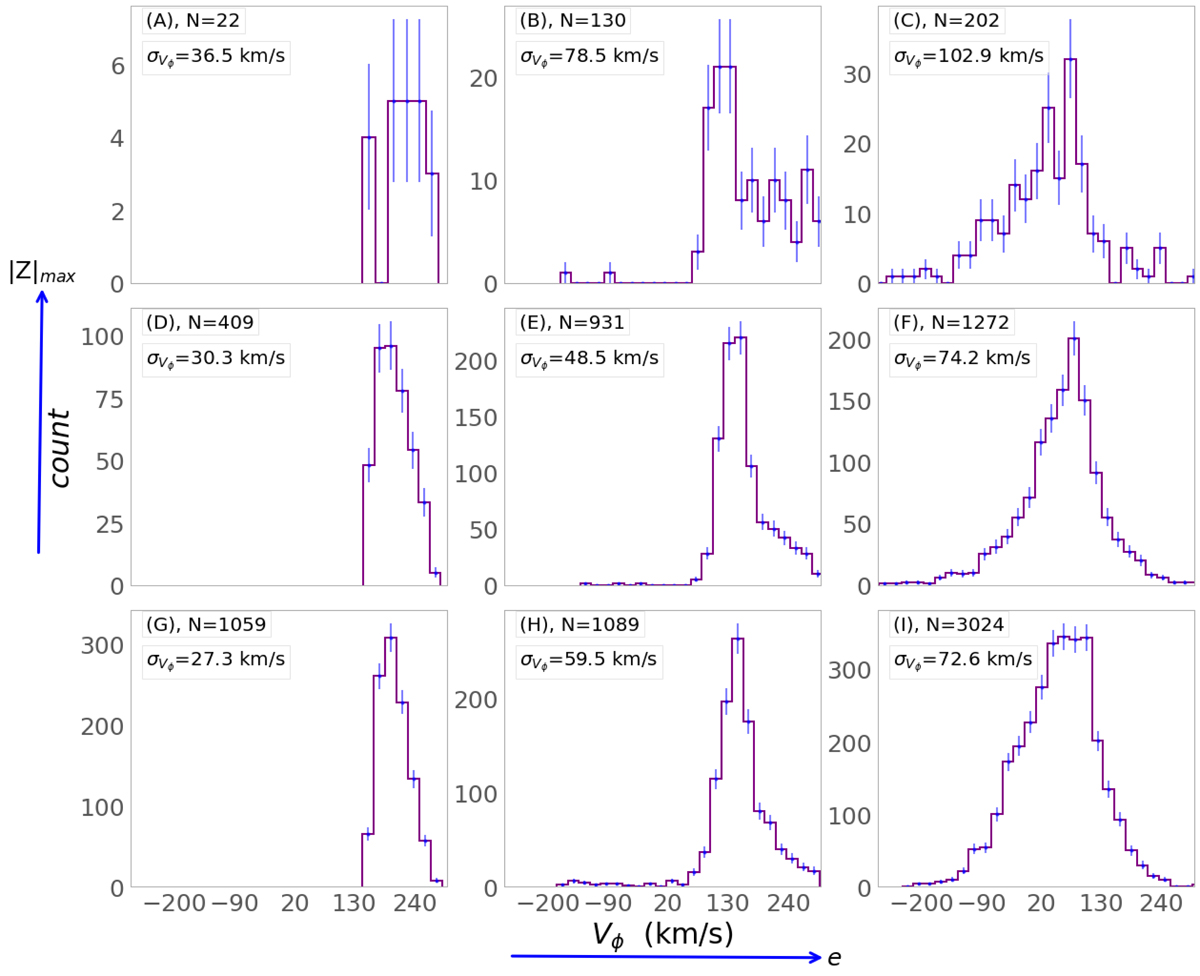
Vϕ distribution for each cell defined in Fig. 20. The value of the dispersion in Vϕ is also shown for each cell. Thick disc stars with Vϕ ∼ 140 km s−1 are seen in panels H and E where there is less contamination by thin disc stars (with Vϕ around 200 km s−1 – cells G and D) and the spheroidal component (with Vϕ around 80 km s−1 cells I, F, and C). A counter-rotating tail is noticeable in cell C.
Current usage metrics show cumulative count of Article Views (full-text article views including HTML views, PDF and ePub downloads, according to the available data) and Abstracts Views on Vision4Press platform.
Data correspond to usage on the plateform after 2015. The current usage metrics is available 48-96 hours after online publication and is updated daily on week days.
Initial download of the metrics may take a while.