Fig. 21.
Download original image
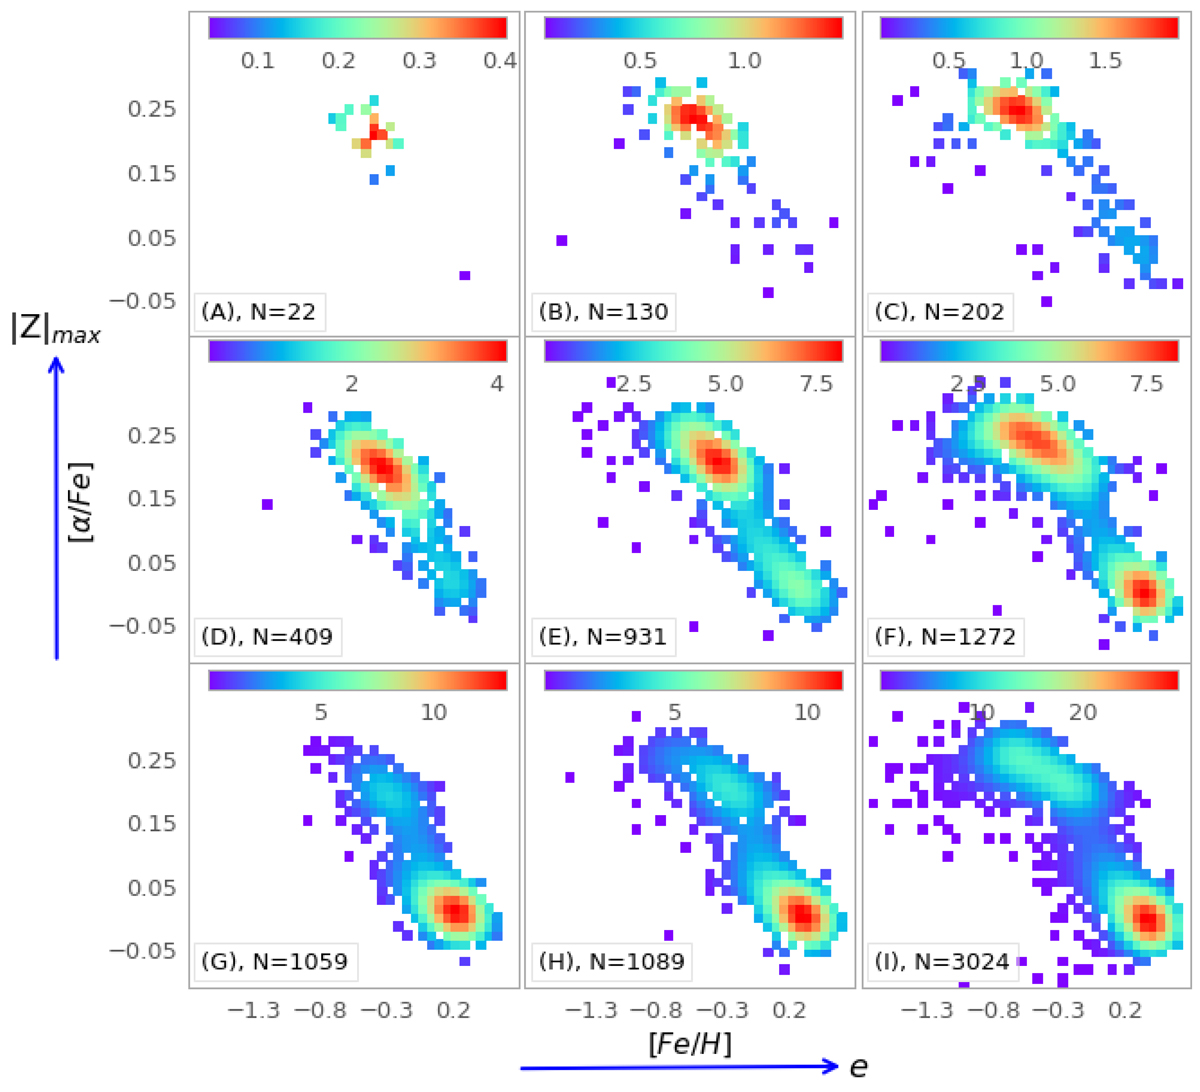
[α/Fe] vs. [Fe/H] for each cell defined in Fig. 20. The number of stars for each cell is indicated next to the panel labels. The rightmost columns, dominated by large eccentricity stars (pressure-supported component), show larger alpha-enhancement ([α/Fe] ∼ 0.25) than what is seen among the low-eccentricity stars. The (inner) thin-disc contribution is seen mostly in the lower row, with a low, near-solar [α/Fe] ratio, which peaks at [Fe/H] = 0.2 in cells (G) and (H), and at 0.25 in cell (I).
Current usage metrics show cumulative count of Article Views (full-text article views including HTML views, PDF and ePub downloads, according to the available data) and Abstracts Views on Vision4Press platform.
Data correspond to usage on the plateform after 2015. The current usage metrics is available 48-96 hours after online publication and is updated daily on week days.
Initial download of the metrics may take a while.