Free Access
Fig. 20.
Download original image
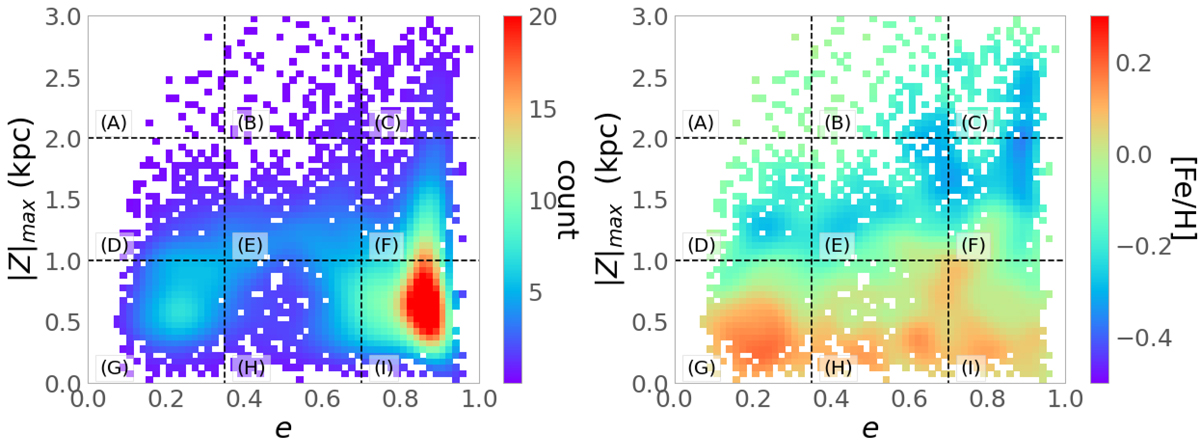
|Z|max vs. eccentricity (e) diagram for the RPM sample. Left panel: colour shows the count of stars per bin and in the right panel: colour shows the mean [Fe/H] content per bin. We define nine windows in this diagram indicated by the letters (A) to (I).
Current usage metrics show cumulative count of Article Views (full-text article views including HTML views, PDF and ePub downloads, according to the available data) and Abstracts Views on Vision4Press platform.
Data correspond to usage on the plateform after 2015. The current usage metrics is available 48-96 hours after online publication and is updated daily on week days.
Initial download of the metrics may take a while.